What Is Analytics Sprawl?
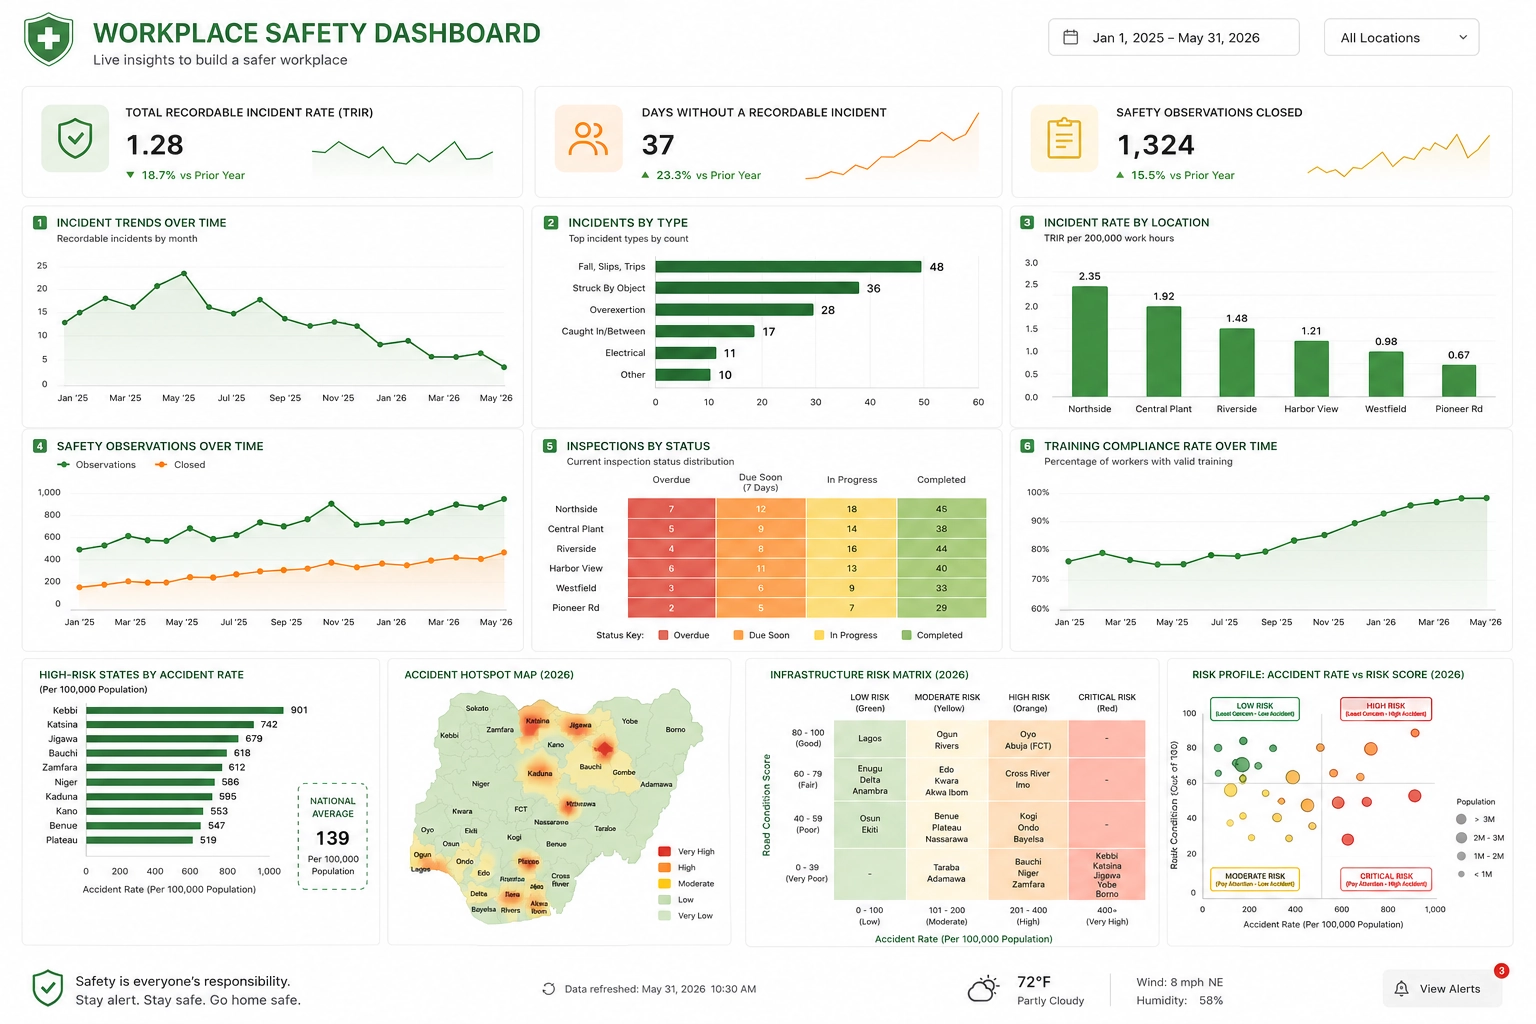
Analytics sprawl occurs when an organization accumulates too many dashboards, reports, data sources, metrics, and analytics tools without sufficient governance or coordination.
As business intelligence programs grow, different departments often create their own reports, KPIs, and data definitions.
Over time, this can lead to duplicate content, conflicting metrics, inconsistent reporting practices, and difficulty determining which analytics assets should be trusted.

Short Answer
Analytics sprawl is the uncontrolled growth of dashboards, reports, metrics, data sources, and analytics tools across an organization. It occurs when different teams create their own reporting assets without centralized governance, resulting in duplicate reports, conflicting KPI definitions, data silos, and reduced trust in analytics. Organizations can reduce analytics sprawl by standardizing metrics, governing dashboards, maintaining a business metric catalog, and establishing a single source of truth for reporting.
Understanding Analytics Sprawl
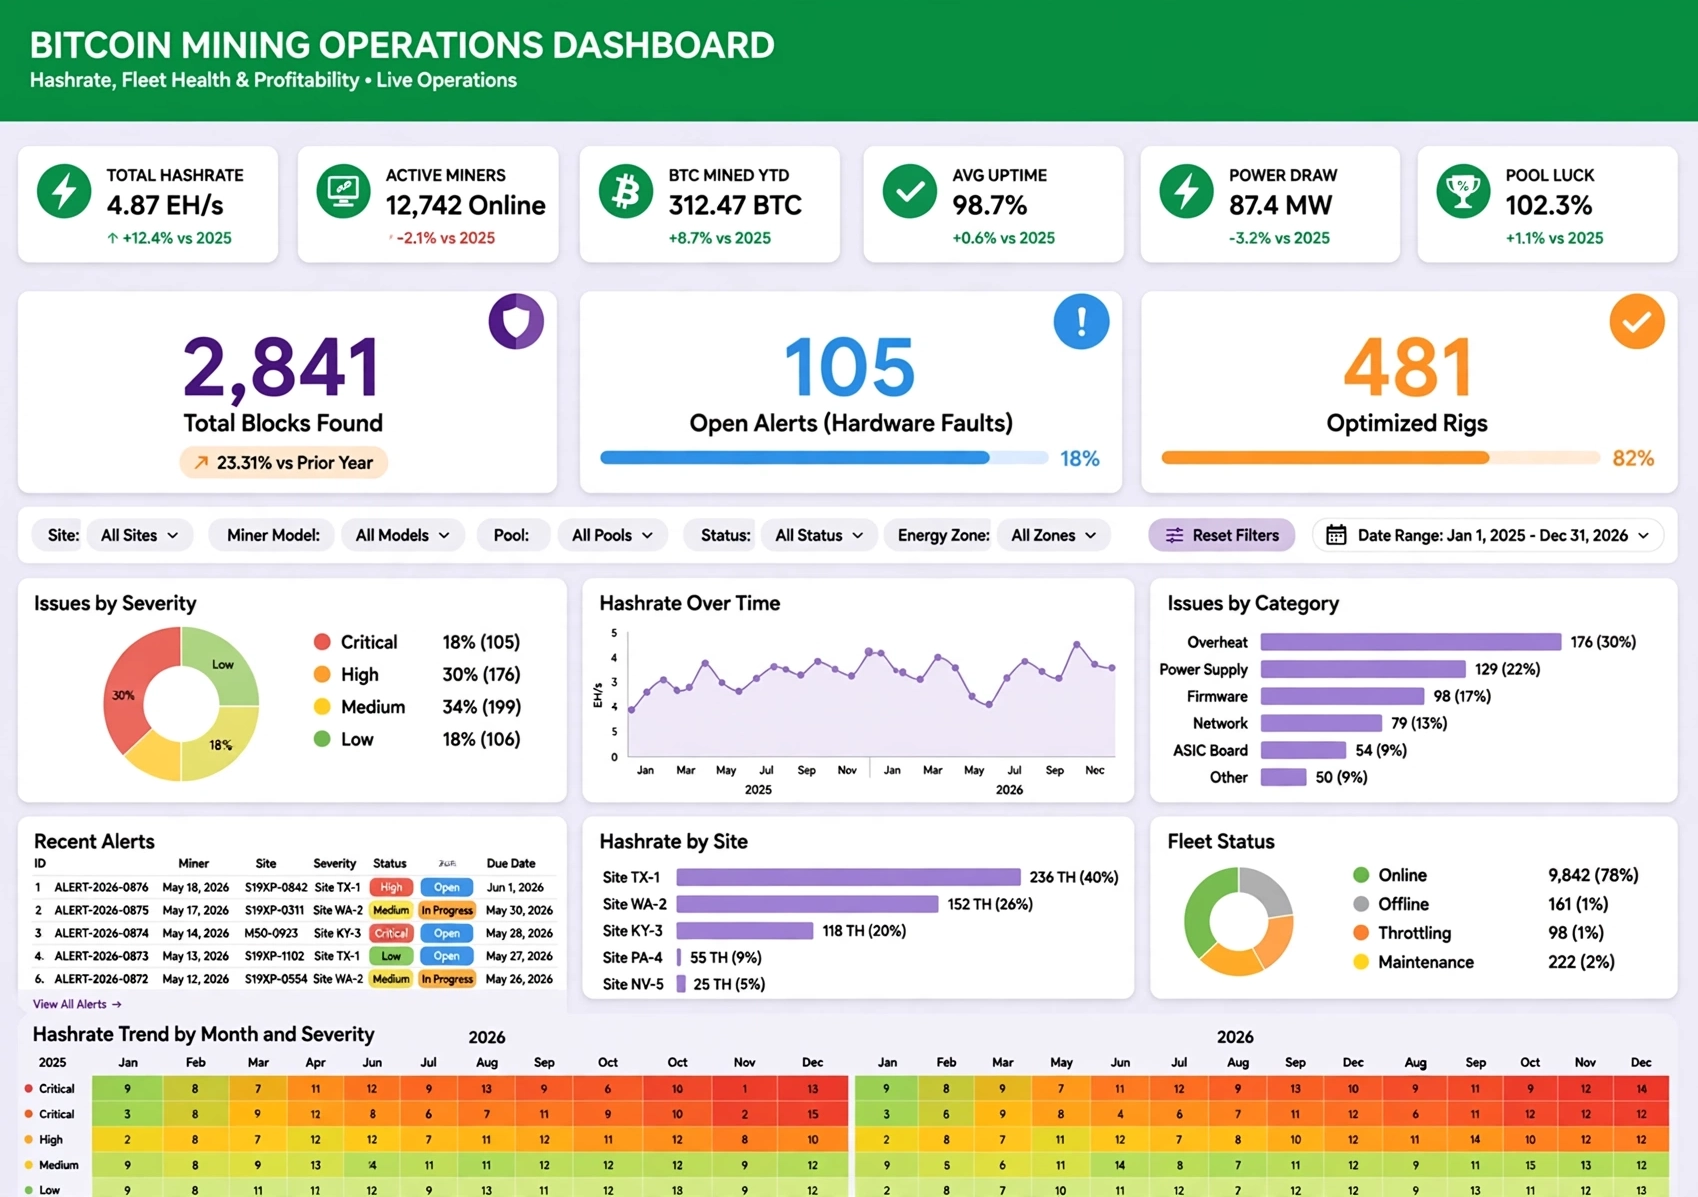
Most organizations begin their analytics journey with a small number of reports designed to answer specific business questions. As demand for data grows, new dashboards are created for additional teams, projects, and stakeholders. While this growth can initially provide greater visibility into operations, it can eventually become difficult to manage.
Analytics sprawl develops when reporting assets multiply faster than governance processes. Multiple departments may create similar dashboards, define metrics differently, or source data from separate systems. The result is an analytics environment that becomes increasingly complex and difficult to navigate.
Common Signs of Analytics Sprawl
Organizations experiencing analytics sprawl often display several recognizable symptoms.
- Hundreds or thousands of reports with overlapping content
- Duplicate dashboards serving similar purposes
- Conflicting KPI values across departments
- Multiple versions of the same report
- Users unsure which dashboard to trust
- Excessive time spent validating numbers
- Growing maintenance requirements for BI teams
- Increasing use of disconnected spreadsheets and shadow reporting systems
These issues can reduce confidence in analytics and slow decision-making throughout the organization.
What Causes Analytics Sprawl?
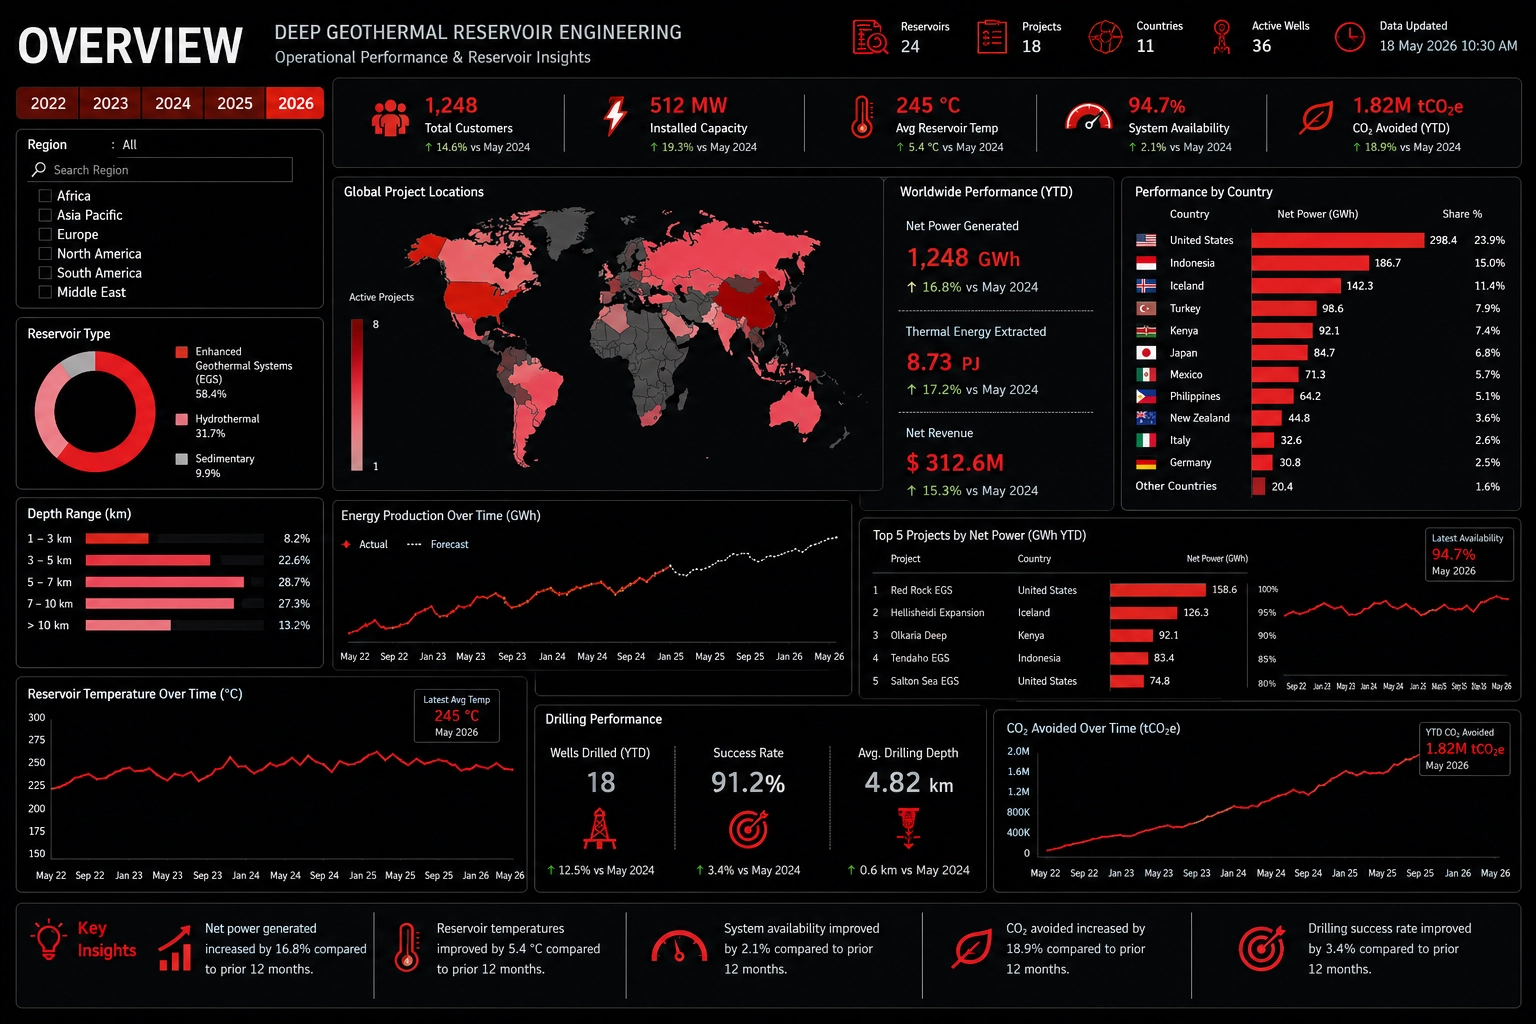
Several factors contribute to analytics sprawl, particularly in organizations with rapidly growing data programs.
Self-Service Analytics Growth
Self-service BI allows business users to create reports independently. While this increases agility, it can also lead to numerous dashboards addressing similar business needs.
Lack of Data Governance
Without governance standards, teams may create their own definitions for important business metrics, leading to inconsistencies and confusion.
Departmental Silos
Sales, finance, operations, marketing, and human resources often develop separate analytics environments. These silos can produce duplicate reporting efforts and inconsistent calculations.
Rapid Technology Expansion
Organizations frequently adopt multiple reporting, visualization, database, and analytics platforms over time. Each tool may generate its own collection of reports and metrics.
Changing Business Requirements
As organizations evolve, reporting needs change. New dashboards are often created while older reports remain active, resulting in a growing inventory of rarely used content.
The Impact of Analytics Sprawl
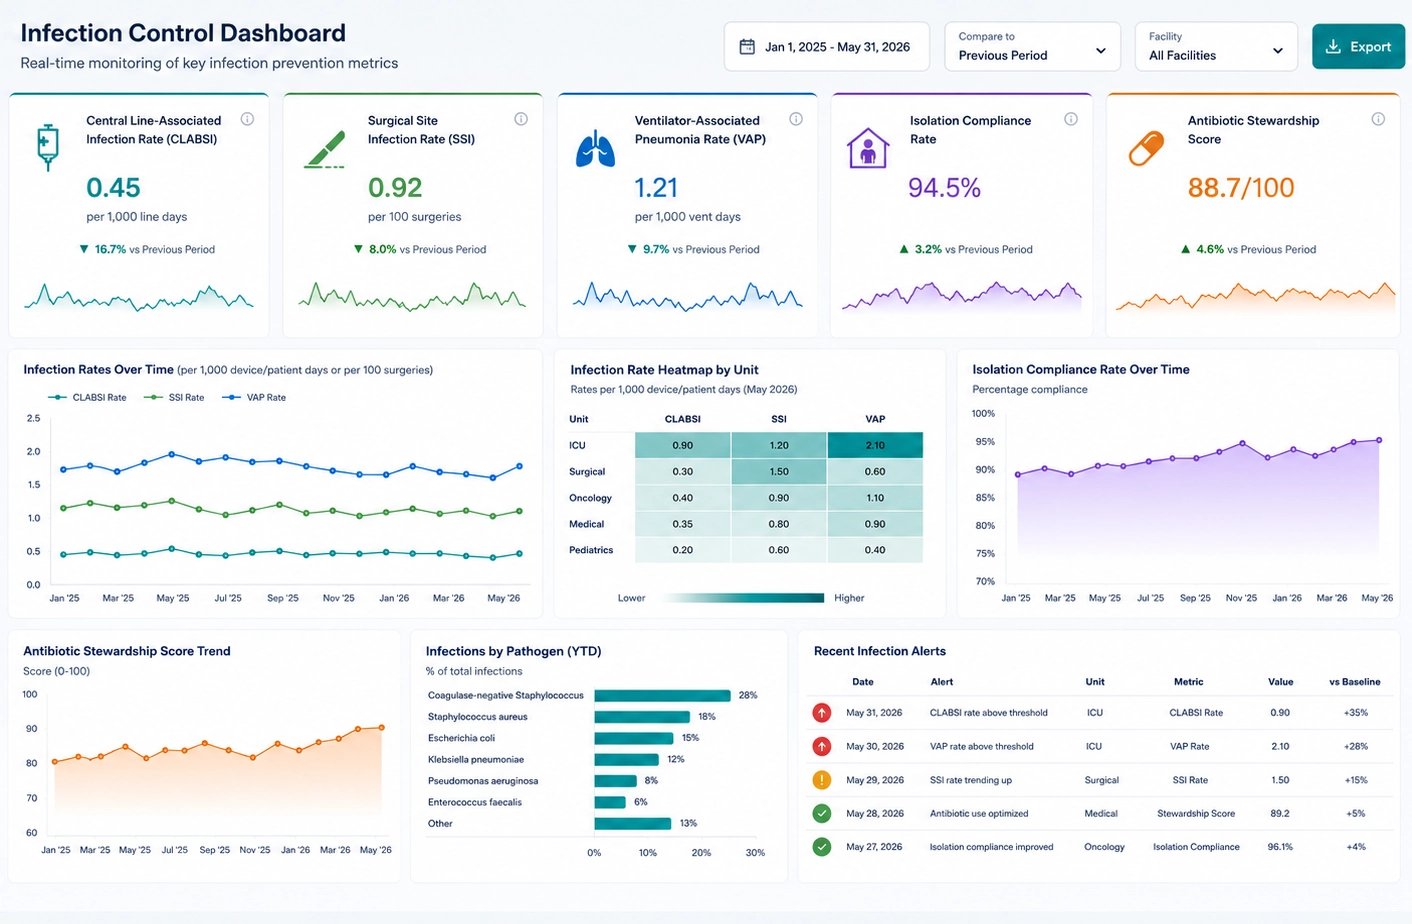
Analytics sprawl creates challenges that extend beyond reporting complexity. It can affect business performance, operational efficiency, and strategic decision-making.
Common consequences include:
- Reduced trust in reported data
- Longer decision-making cycles
- Increased BI maintenance costs
- Difficulty identifying authoritative metrics
- Lower dashboard adoption rates
- Greater compliance and governance risks
- Wasted resources maintaining unused reports
When users encounter conflicting information across dashboards, confidence in the analytics ecosystem often declines.
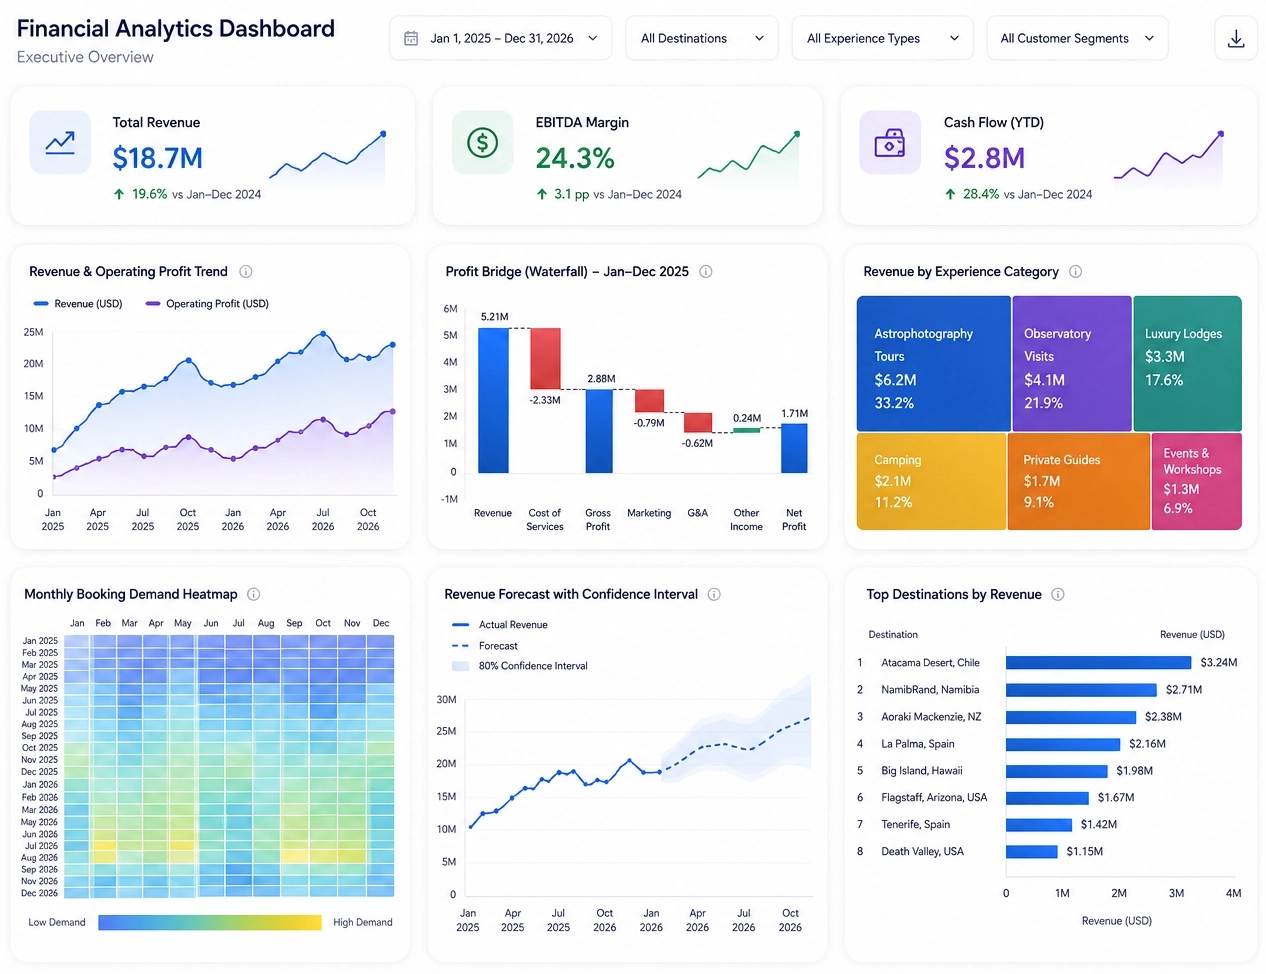
Analytics Sprawl vs. Dashboard Proliferation
The terms analytics sprawl and dashboard proliferation are closely related, but they are not identical. Dashboard proliferation refers specifically to the growth of dashboards and reports. Analytics sprawl is broader and includes metrics, data sources, reporting tools, datasets, calculations, and governance processes.
Dashboard proliferation is often one of the most visible symptoms of wider analytics sprawl.
The Role of Metric Standardization
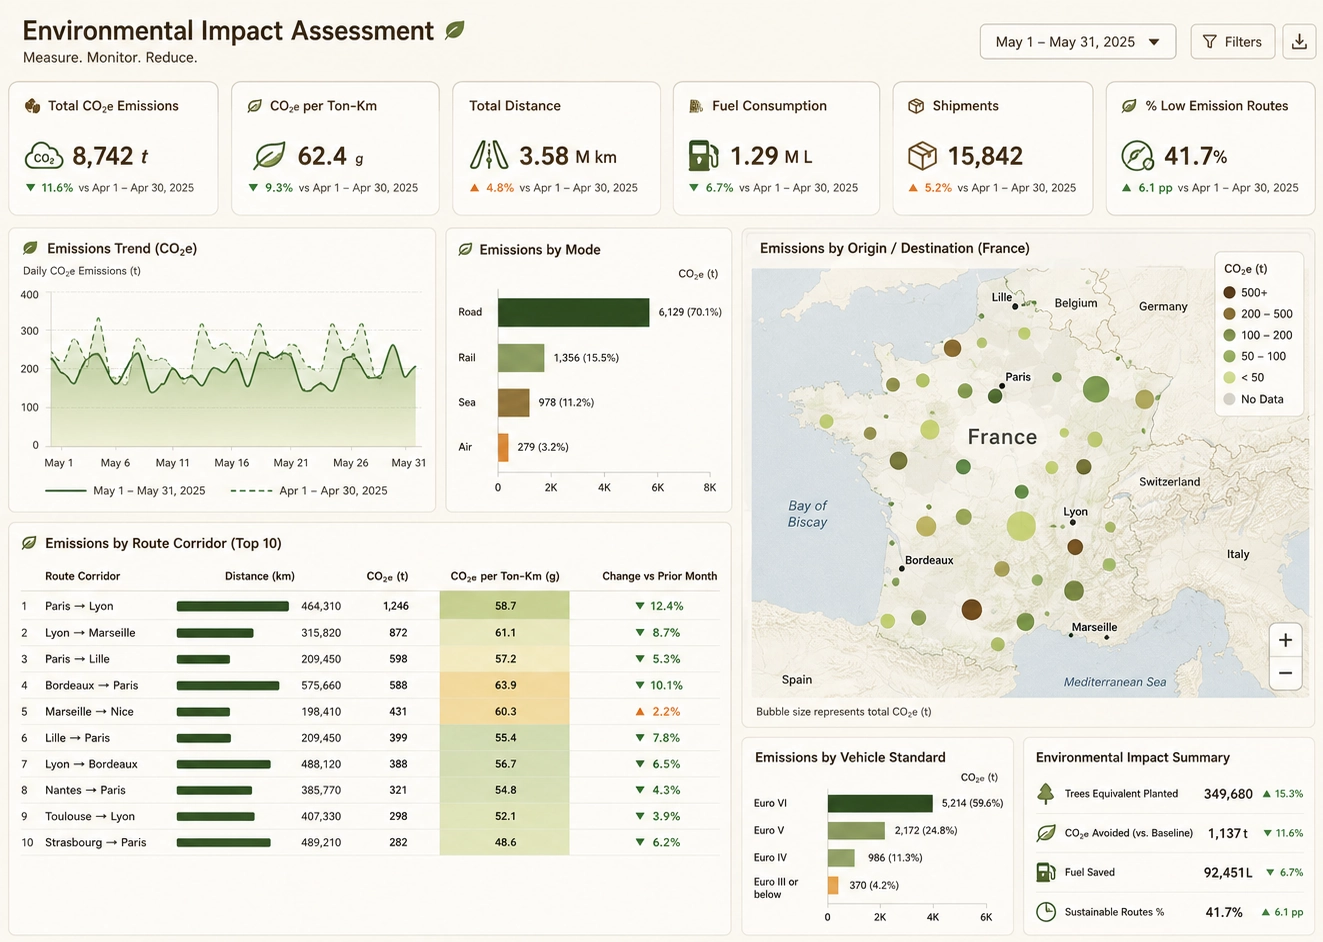
One of the primary drivers of analytics sprawl is inconsistent metric definitions. Different departments may calculate revenue, customer acquisition, profitability, or retention using different formulas. As a result, reports that appear similar may produce conflicting results.
Organizations can address this challenge by establishing certified metrics and maintaining a centralized KPI dictionary or business metric catalog. Standardized definitions help ensure that everyone measures performance consistently.
How to Reduce Analytics Sprawl
Reducing analytics sprawl requires a combination of governance, technology, and organizational alignment.
- Create a centralized catalog of dashboards and reports
- Define and certify business metrics
- Establish data governance policies
- Retire outdated or unused dashboards
- Monitor dashboard adoption and usage patterns
- Promote a single source of truth for key metrics
- Standardize data models and semantic definitions
- Conduct regular analytics audits
These practices help organizations maintain a manageable and trusted analytics environment while still supporting self-service reporting capabilities.
Governance as the Long-Term Solution
Effective governance does not prevent the creation of new dashboards or reports. Instead, it establishes guidelines that ensure analytics assets remain accurate, discoverable, and aligned with organizational objectives.
Governance frameworks typically include metric ownership, report certification, usage monitoring, data quality standards, and lifecycle management processes. Together, these controls help prevent the uncontrolled expansion of analytics resources.
Analytics Sprawl in Modern Business Intelligence
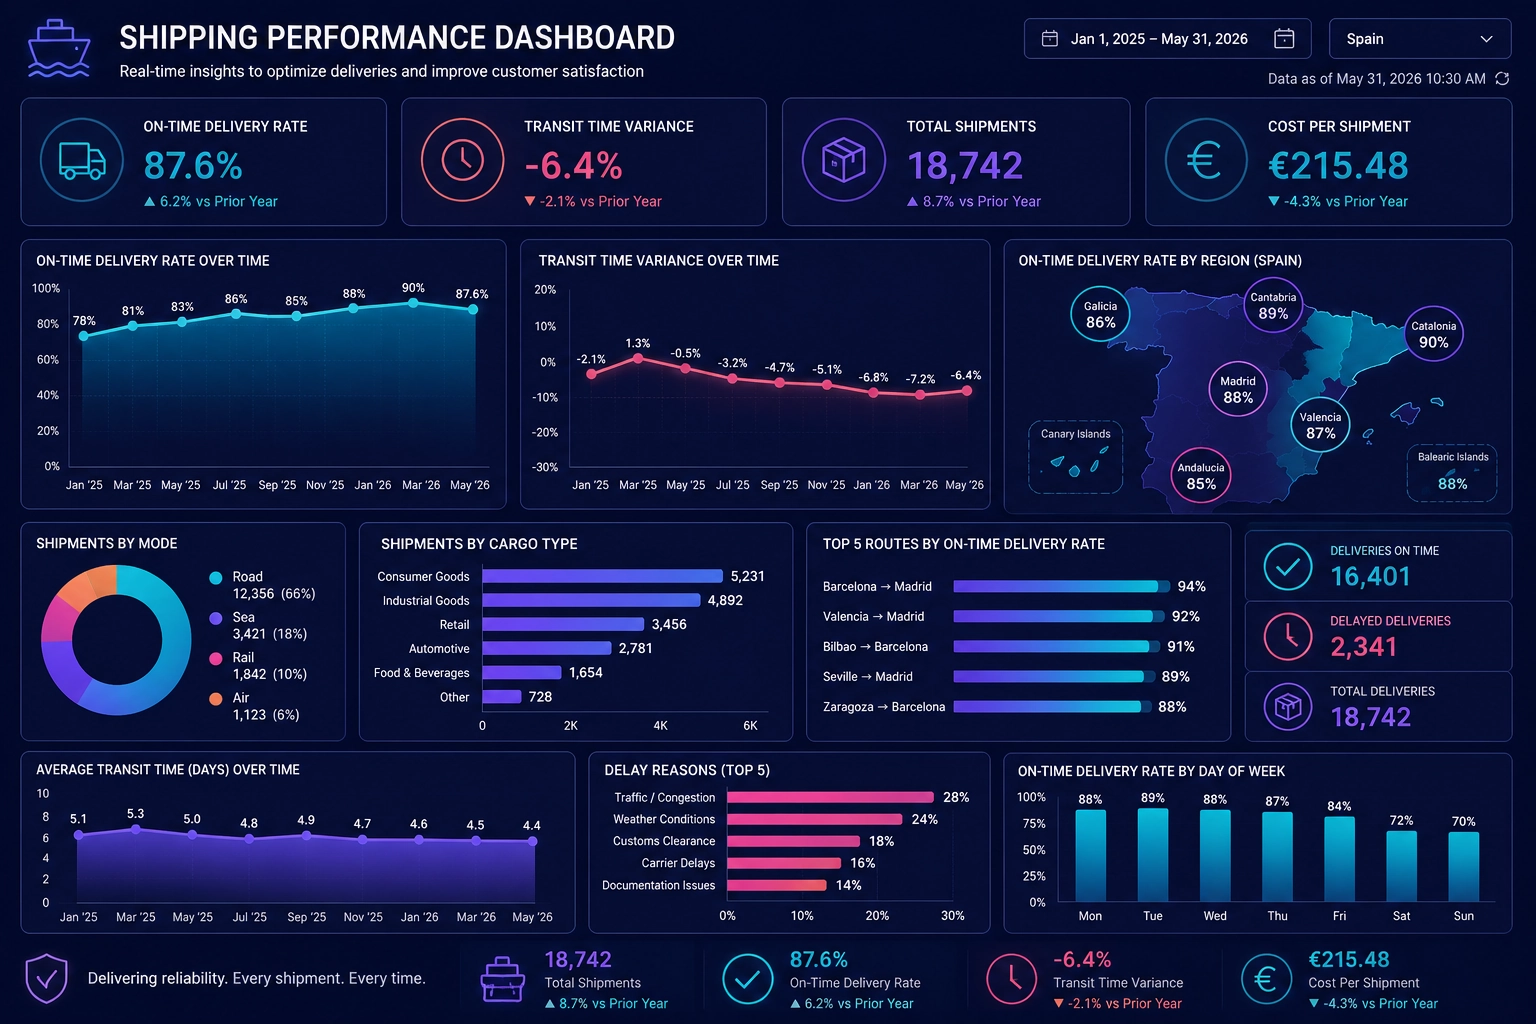
Modern business intelligence platforms provide tools that help organizations manage analytics sprawl through centralized governance, metadata management, certified metrics, usage tracking, and report cataloging. These capabilities improve consistency while preserving the flexibility that users expect from self-service analytics.
As organizations continue to generate and consume more data, managing analytics sprawl becomes increasingly important. By controlling the growth of dashboards, reports, and metrics, businesses can build a more trustworthy analytics environment and enable faster, more confident decision-making.