What Is KPI Volatility?
KPI volatility refers to the degree to which a key performance indicator fluctuates over time. Highly volatile KPIs experience frequent or large changes between reporting periods, while stable KPIs tend to move gradually and predictably. Understanding KPI volatility helps organizations distinguish between normal business variation and meaningful performance changes that require management attention.
In modern business intelligence environments, organizations monitor KPI volatility to improve forecasting, strengthen decision-making, and avoid reacting unnecessarily to routine fluctuations. Analytics platforms such as StyleBI help users visualize trends, identify unusual changes, and analyze the underlying drivers of KPI movement.
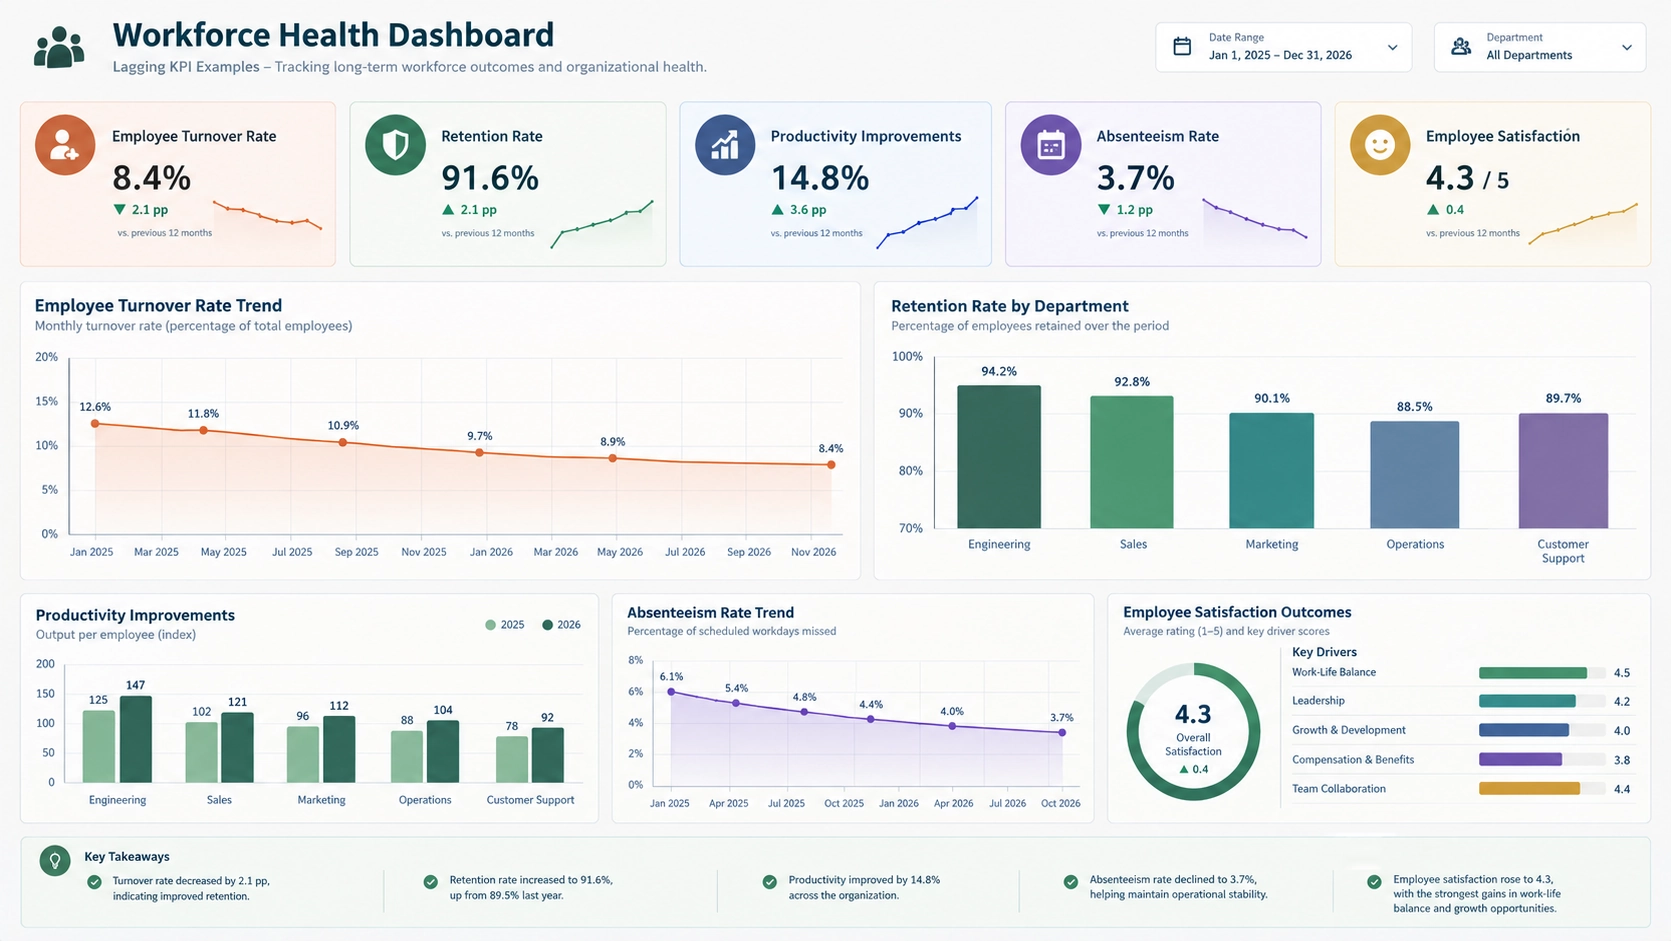

Understanding KPI Volatility
Every business metric changes over time. Sales revenue, customer acquisition, operational costs, inventory levels, website traffic, and employee productivity naturally rise and fall as business conditions change.
KPI volatility measures how dramatic and frequent those changes are. A volatile KPI may show significant increases one week and sharp declines the next. A low-volatility KPI generally remains within a relatively narrow range and follows more predictable patterns.
Volatility is not inherently good or bad. Some businesses operate in highly dynamic environments where volatility is expected, while others prioritize stability and consistency.
Examples of KPI Volatility
High Volatility KPIs
- Daily website traffic.
- Online advertising conversion rates.
- Cryptocurrency trading revenue.
- Seasonal retail sales.
- Social media engagement metrics.
Low Volatility KPIs
- Employee turnover rate.
- Customer retention rate.
- Annual contract renewal rate.
- Manufacturing capacity utilization.
- Long-term operating margin.
Understanding whether volatility is expected helps organizations interpret KPI performance correctly and avoid unnecessary concern over short-term fluctuations.
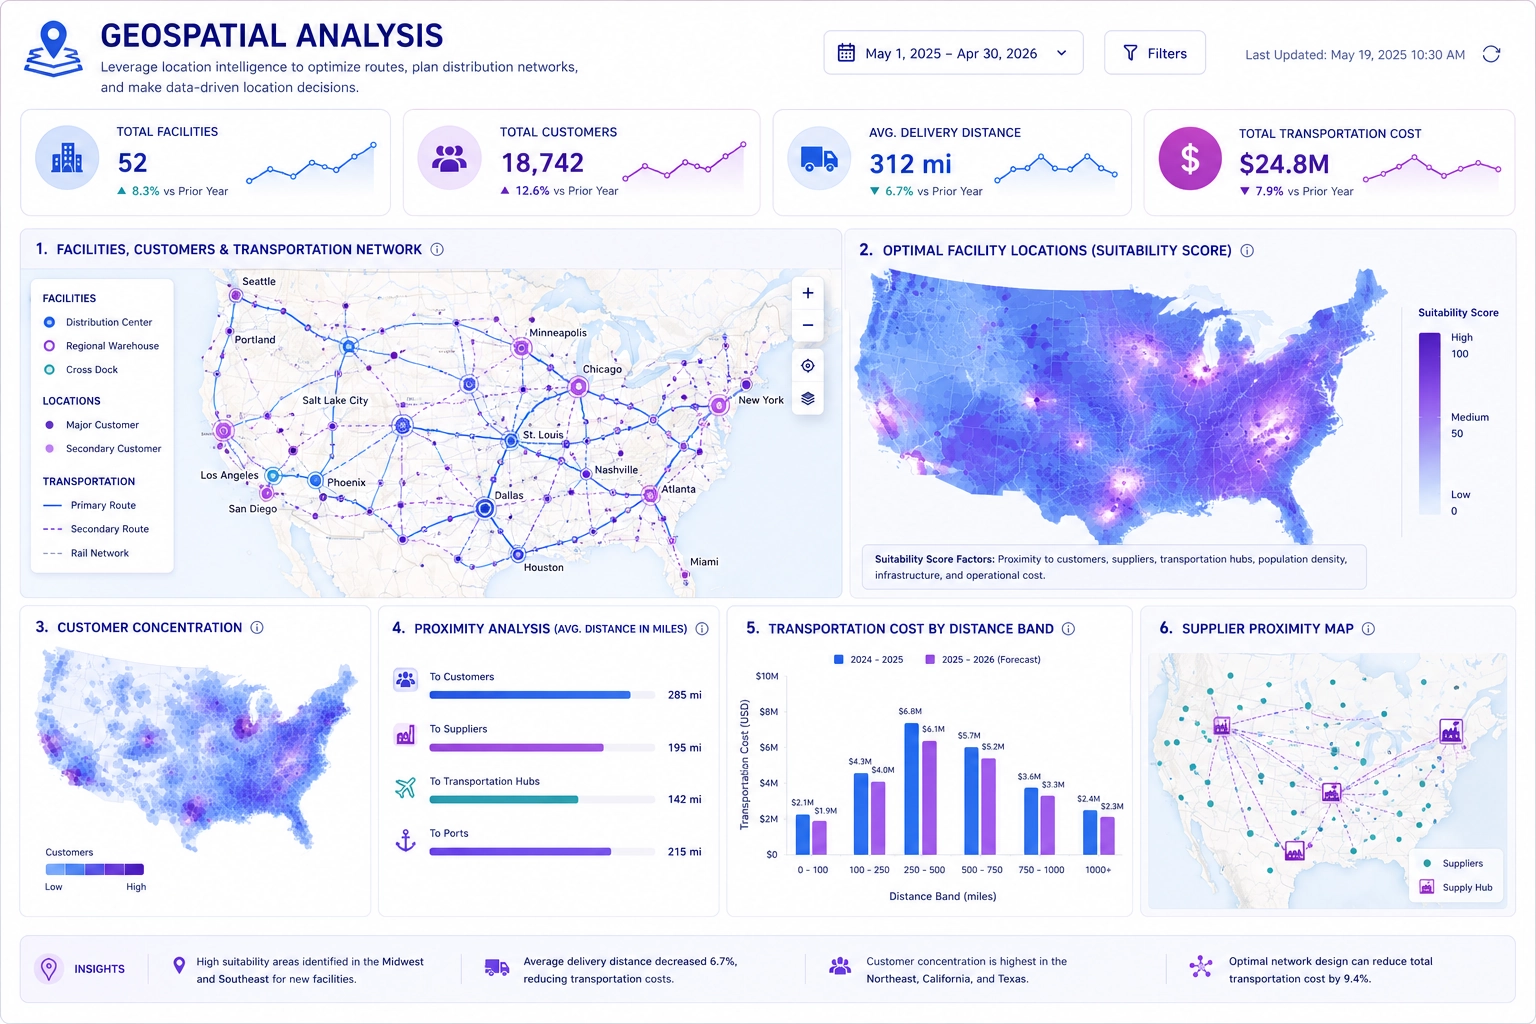
What Causes KPI Volatility?
Seasonal Demand Changes
Many industries experience predictable peaks and valleys during specific months, quarters, holidays, or weather-related periods.
Market Conditions
Economic shifts, competitive activity, inflation, and changing customer preferences can significantly impact KPI behavior.
Promotional Campaigns
Marketing campaigns often generate temporary spikes in traffic, leads, sales, and customer engagement.
Operational Disruptions
Supply chain issues, staffing shortages, equipment failures, or vendor delays can create sudden KPI fluctuations.
Data Quality Issues
Changes in source systems, reporting logic, integrations, or KPI definitions may create artificial volatility that does not reflect actual business performance.
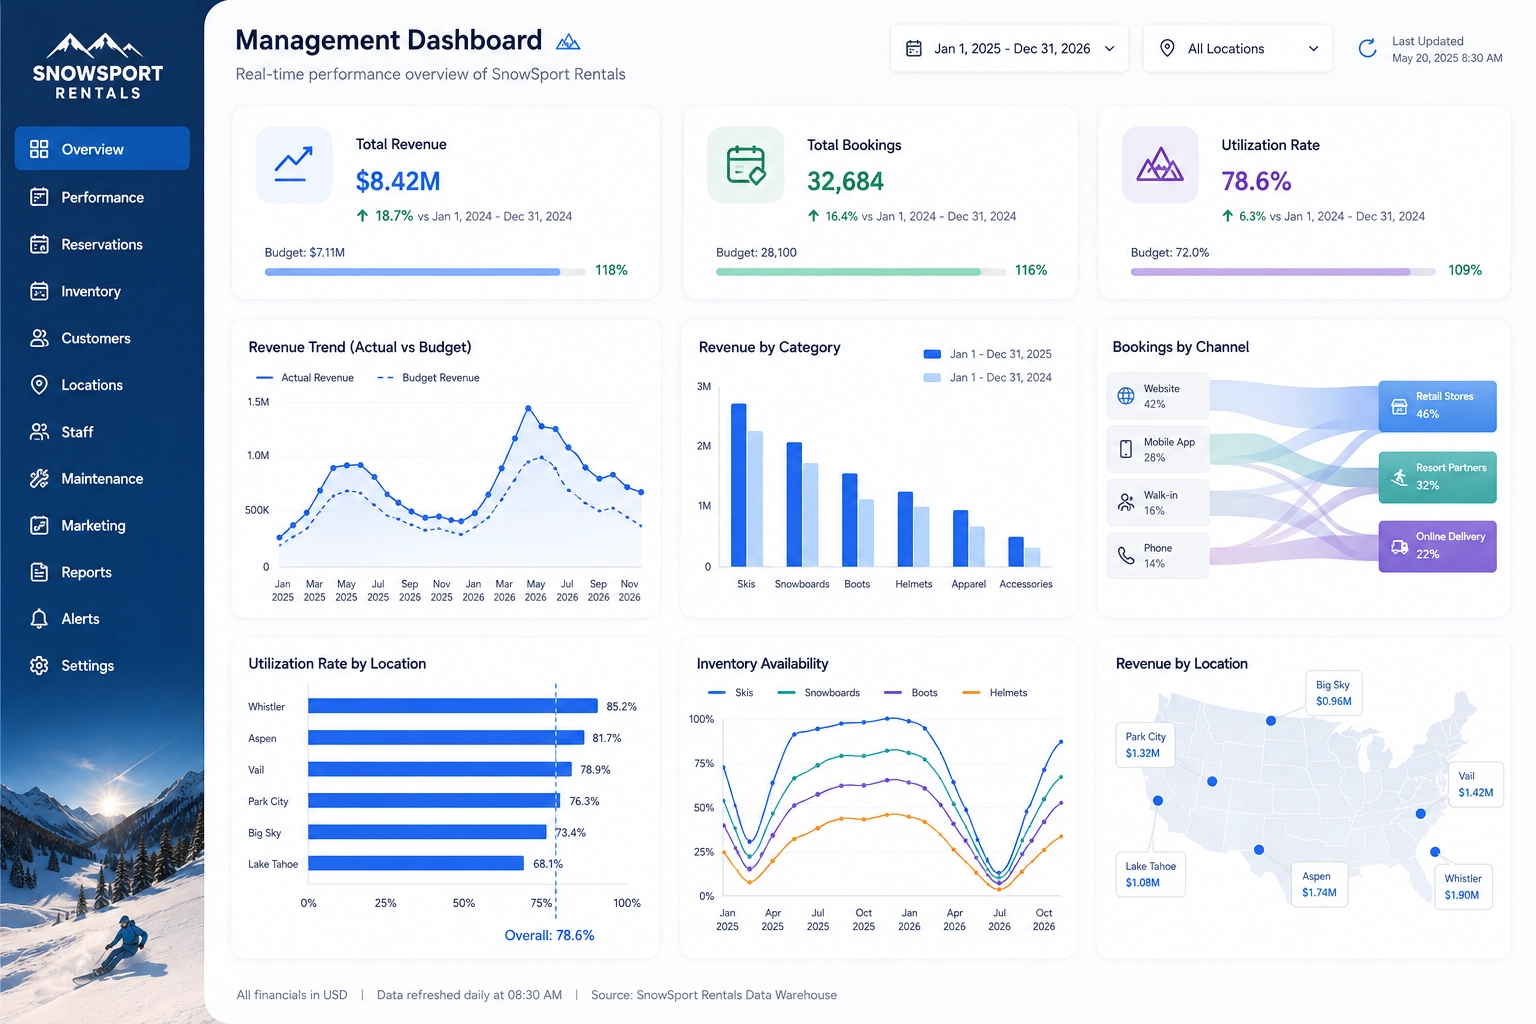
Why KPI Volatility Matters
Volatility affects how organizations interpret business performance and allocate resources. Without understanding expected levels of variation, decision makers may overreact to routine fluctuations or overlook meaningful performance changes.
Monitoring KPI volatility helps organizations:
- Improve forecasting accuracy.
- Detect emerging business risks earlier.
- Establish realistic performance targets.
- Reduce false alarms caused by routine fluctuations.
- Differentiate normal variation from actual problems.
- Improve confidence in performance reporting.
How KPI Volatility Is Measured
Organizations evaluate volatility by examining historical KPI behavior over time. Analysts typically compare current values against historical averages, prior reporting periods, forecasts, budgets, or statistical benchmarks.
Common approaches include:
- Period-over-period percentage changes.
- Moving averages.
- Trend analysis.
- Variance analysis.
- Control charts.
- Statistical deviation measurements.
These methods help determine whether KPI movements fall within expected ranges or indicate unusual business conditions.
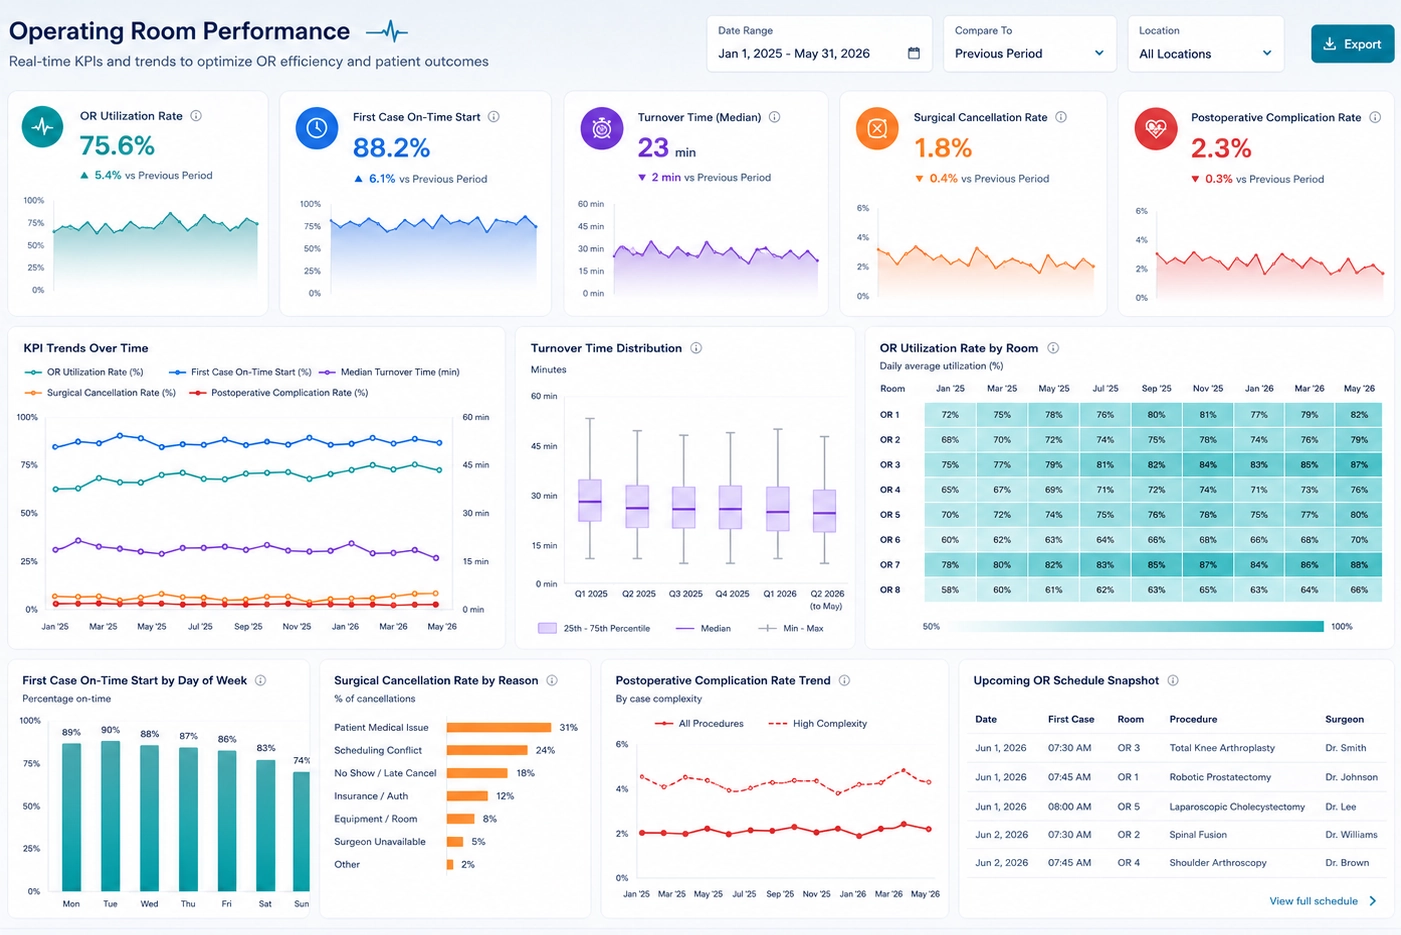
Analyzing KPI Volatility with StyleBI
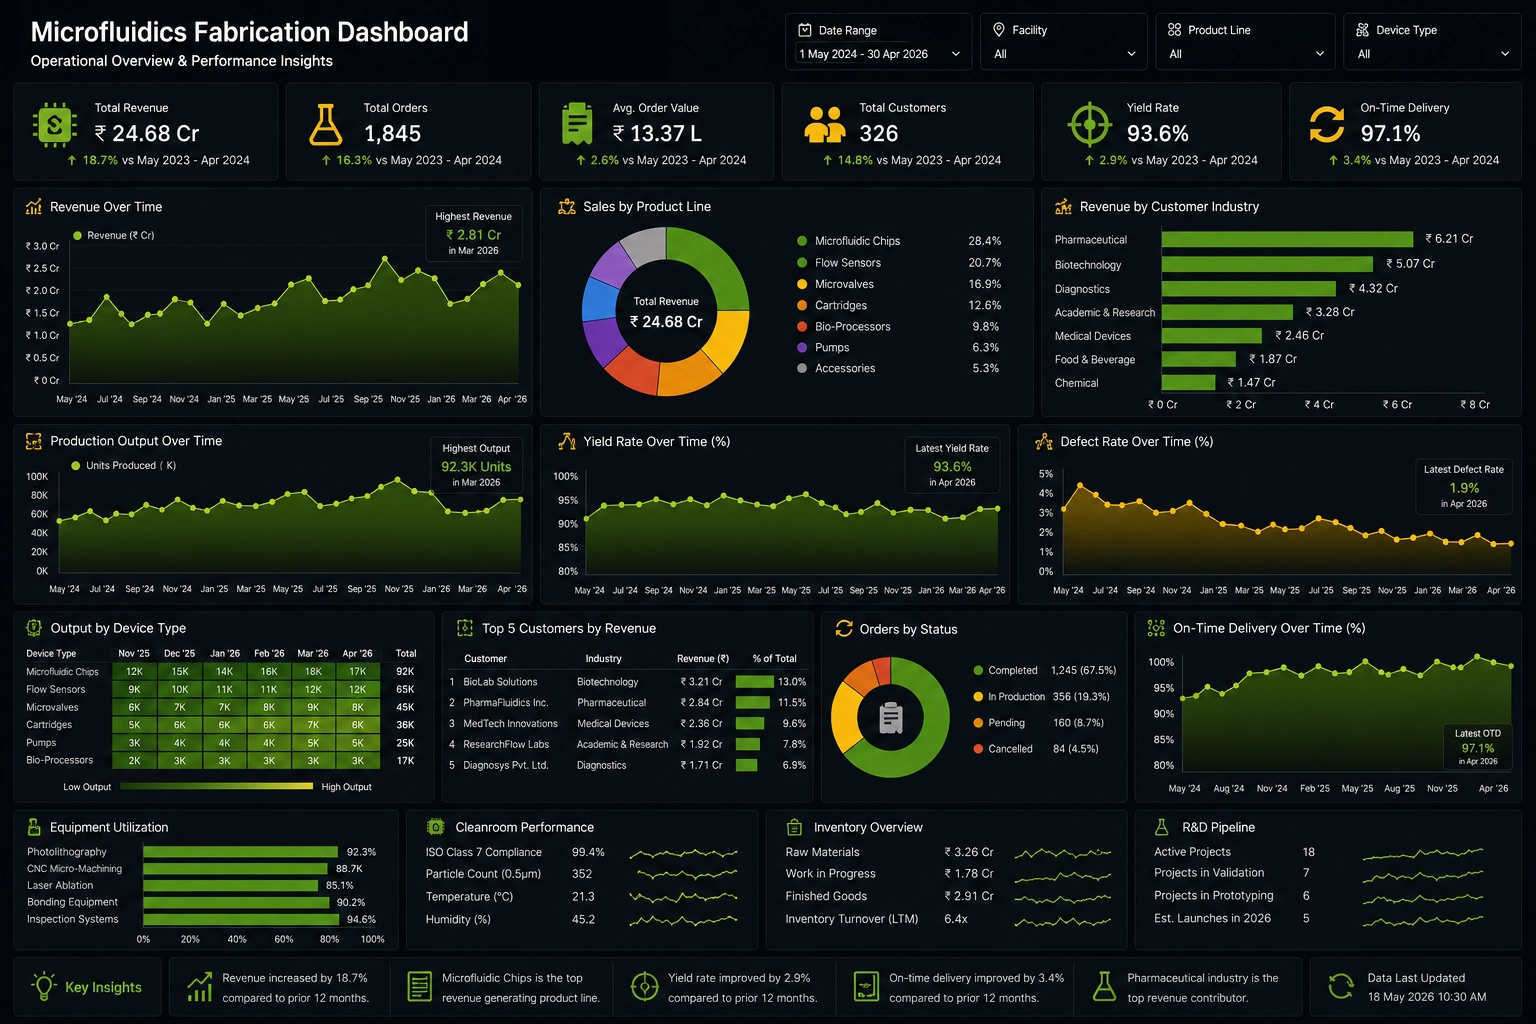
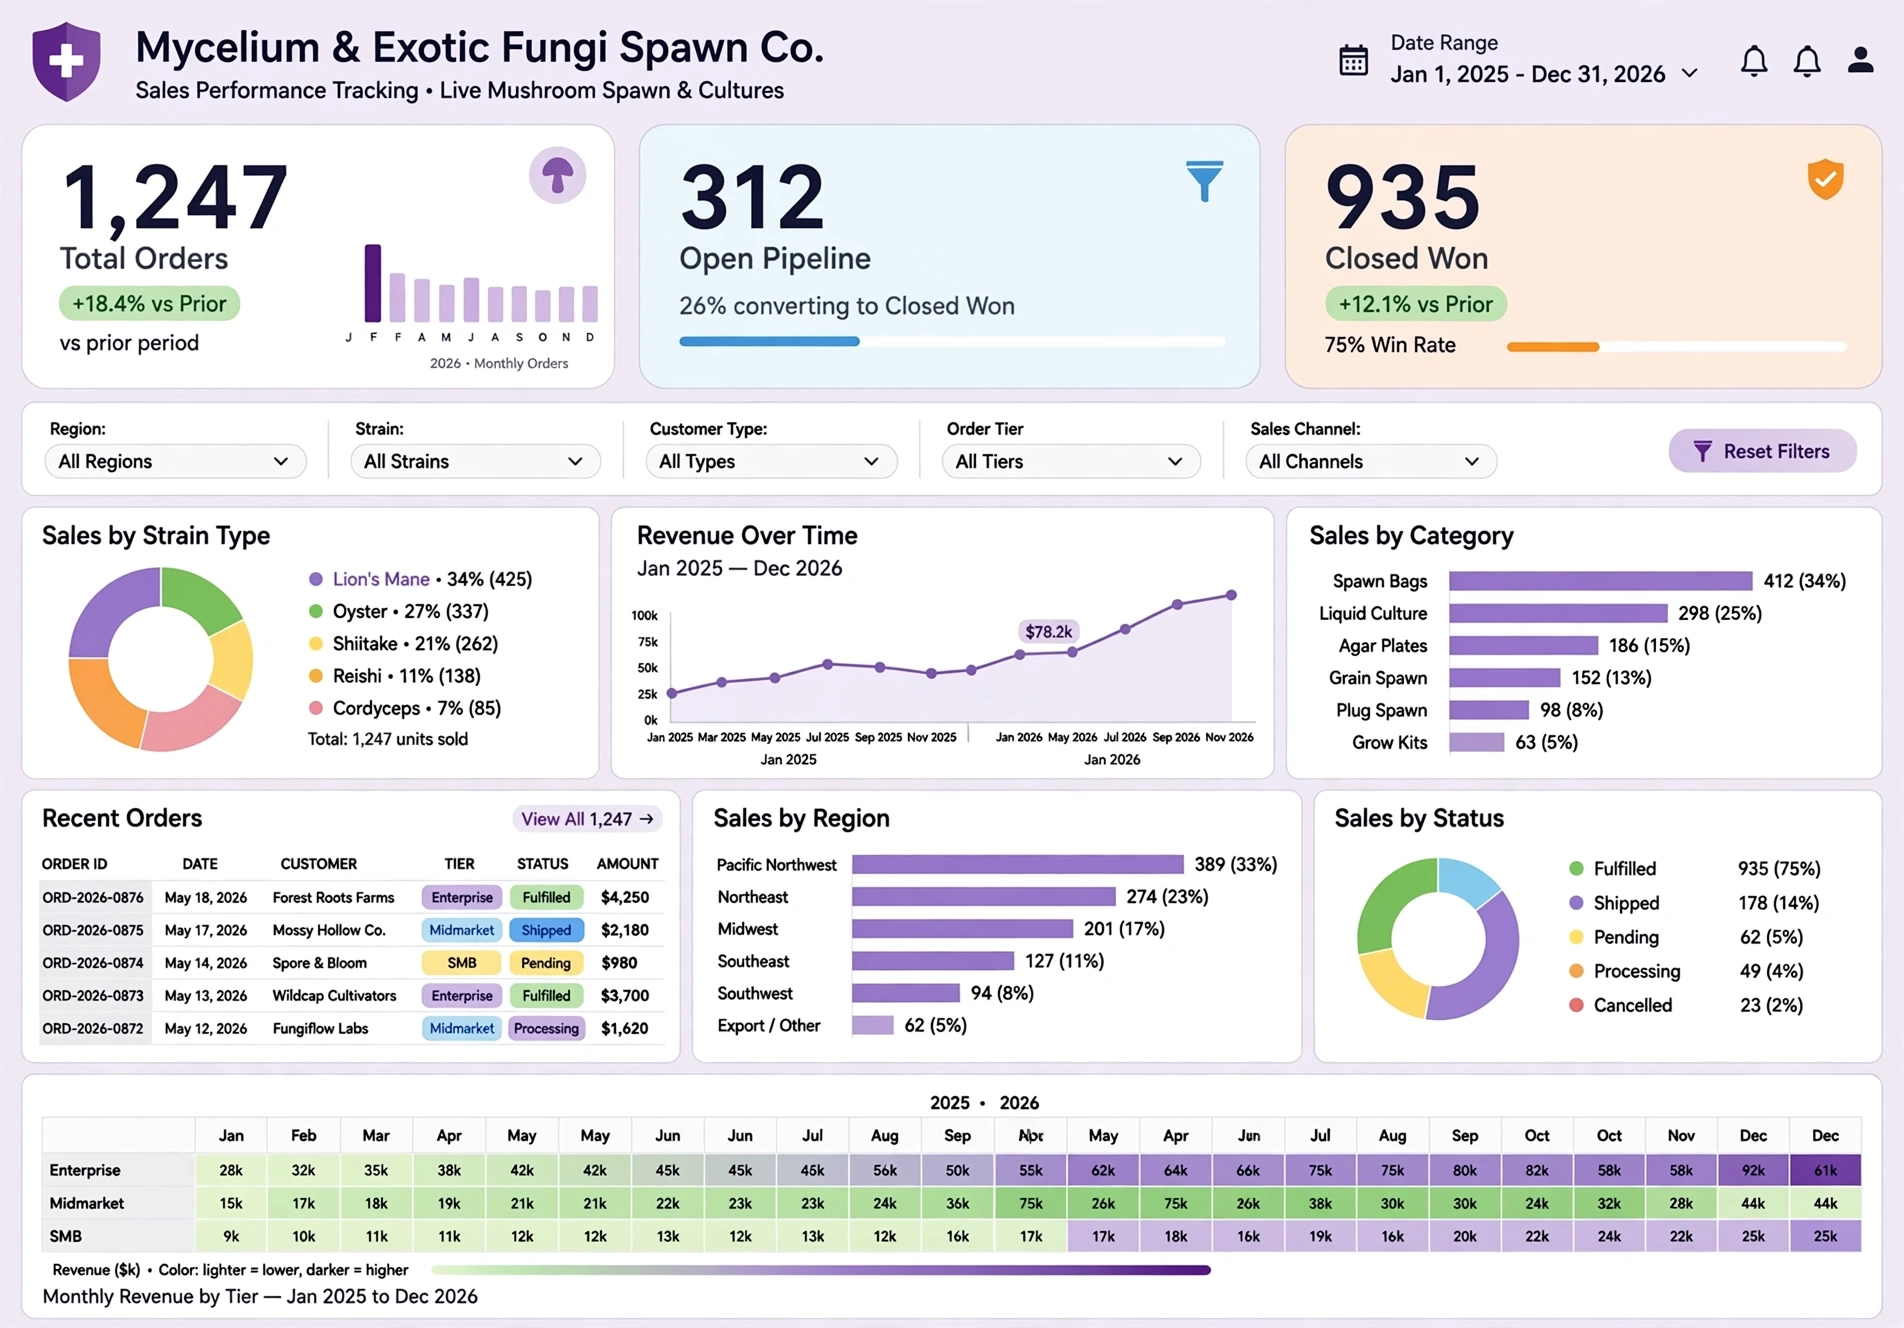
StyleBI enables organizations to visualize KPI behavior through interactive dashboards, scorecards, trend charts, and drill-down analytics. Users can compare current performance against historical patterns and quickly identify abnormal KPI fluctuations.
Conditional formatting, threshold indicators, and alerts help business users focus on significant changes rather than routine variation. Interactive exploration tools allow users to investigate the causes behind sudden KPI movements and identify contributing factors.
By consolidating data from multiple business systems, StyleBI provides a comprehensive view of performance drivers and volatility patterns across the organization.
Real-World Use Case: E-Commerce Revenue Volatility
An online retailer experiences significant fluctuations in daily revenue throughout the year. During normal periods, sales remain relatively steady. However, promotions, holidays, competitor pricing actions, and changing customer demand create sudden revenue spikes and declines.
Company executives use a StyleBI dashboard to monitor revenue volatility across product categories, geographic regions, and marketing channels. Historical trend charts reveal that several large revenue swings coincide with specific promotional activities.
During one quarter, managers notice unusually high volatility in a major product category. Using StyleBI drill-down analysis, they discover supply chain disruptions are causing inventory shortages that lead to inconsistent sales performance.
Armed with these insights, the organization adjusts purchasing strategies, improves inventory planning, and reduces future revenue fluctuations. As a result, forecasts become more accurate and executive confidence in performance reporting improves.
Best Practices for Managing KPI Volatility
- Establish clear KPI definitions and governance standards.
- Analyze long-term trends instead of reacting to individual data points.
- Segment data to identify drivers of volatility.
- Use thresholds and alerts to identify meaningful deviations.
- Compare performance against historical benchmarks.
- Validate data quality before investigating performance changes.
- Document known sources of seasonal variation.
- Review volatility regularly as part of performance management.
Achieving More Effective Performance Management
KPI volatility measures how much performance metrics fluctuate over time. Understanding volatility helps organizations interpret performance accurately, identify risks, improve forecasts, and make better decisions.
With StyleBI, organizations can monitor KPI trends, investigate unusual fluctuations, analyze root causes, and distinguish normal business variation from meaningful performance changes. This visibility enables more effective performance management and greater confidence in data-driven decision-making.