Seamless Embedded Self-Service Dashboards
A complete dashboard and reporting solution needs to provide the right mix of features and ease of use, but also must fit into the host application as seamlessly as possible.
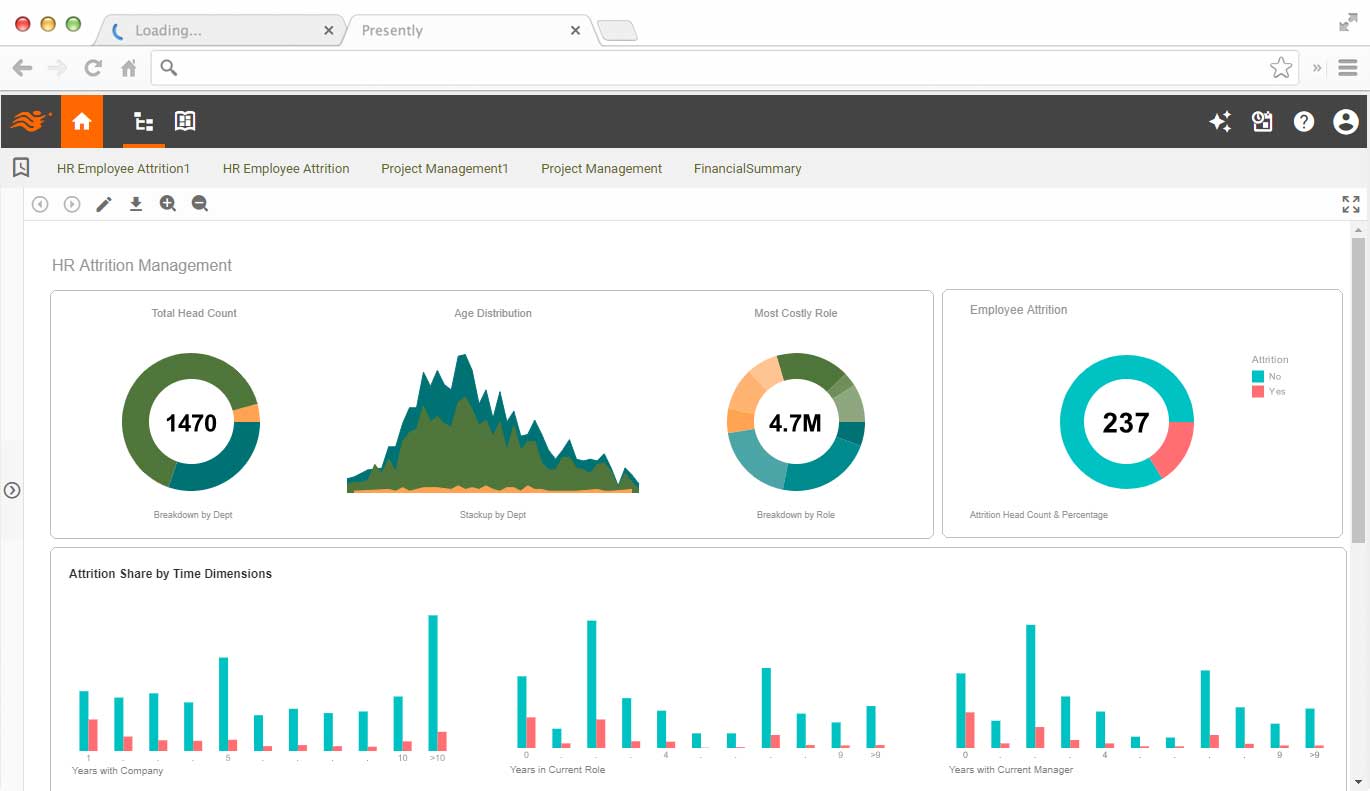
This means that the dashboards and reports must be transparent to the end-user and must look and feel like a normal part of the host application - whether it is used by either internal users or external customers.
Many data intelligence solution providers have built static dashboards, but with InetSoft's 100% web-based application, you'll be able to add self-service visual analytics.

Spotlight on Embedding Features
InetSoft's reporting and dashboard software, StyleBI, is 100% open standards based and relies on these open standards such as AngularJS, REST, and Auth0 to ensure tight integration.
Key features include:
- Single Sign On
- Custom Theming
- Granular Access Control
- Responsive Design
- Lightweight APIs for Automation
- Wide Variety of Data Sources
- Single Web UI for all Devices

Embedding Into a School Management System
When Assembly — a New Zealand–designed Student Management System (SMS) — set out to lift the analytics and reporting experience for schools and the Ministry of Education, they chose to embed InetSoft’s BI engine as the heart of their visual reporting layer. The decision combined a local product (Assembly) with a lightweight, embeddable analytics platform to deliver fast dashboards, Ministry-compliant returns, and easy-to-build, role-specific reports for principals, teachers, and administrative staff.
Context and Goals
Assembly was built specifically for New Zealand schools and their needs — attendance, assessment, pastoral care, and Ministry roll returns are core functional areas. The product team wanted to provide rich, self-service analytics without forcing schools to export data to external tools or retrain staff on a separate BI product. The objectives were clear: embed a reporting engine that could render interactive dashboards inside Assembly, generate Ministry of Education-compliant extracts and reports, support ad-hoc exploration, and scale across many small-to-medium school deployments.
Why InetSoft Was a Practical Fit
- Embeddability: InetSoft’s product family offers an embeddable server and a JavaScript/HTML render layer that can sit inside existing web applications — a match for Assembly’s web-first architecture. This allowed Assembly to integrate analytics without rebuilding its UI or forcing a separate login.
- Lightweight Footprint: Schools often have constrained IT resources. InetSoft’s ability to run with modest server resources meant Assembly could host the analytics layer centrally or offer it as part of a managed service to schools.
- Ministry Reporting Support: Assembly needed to ensure outputs matched Ministry formats and timing. Embedding a configurable BI engine made it easier to automate and validate those extracts and present them visually before submission.

Technical Architecture — How the Embedding Worked
The implementation followed three clear layers: data, analytics server, and UI rendering. Assembly’s transactional database — the canonical source for students, rolls, attendance, and assessments — feeds an ETL/transform process that prepares a modelling schema optimized for reporting. This schema is surfaced to InetSoft’s analytics server which performs in-memory mashups, calculated measures, and aggregates. The analytics server exposes embeddable dashboards and visualizations via iFrames or a JS widget that Assembly mounts in key screens (student hub, principal dashboard, roll returns console). The result is a seamless user experience: teachers see interactive charts inside Assembly’s pages and can drill from a cohort overview down to individual student records without leaving the SMS.
Security, Data Governance and Ministry Compliance
Data sovereignty and secure access were non-negotiable. Assembly implemented role-based access controls that are enforced at both the application and analytics layers; InetSoft’s server accepted only authenticated, signed queries from Assembly and applied row-level security so a teacher could only visualize their class while principals could see school-wide aggregates. Where the Ministry required certified-format roll returns, pre-built InetSoft reports generated PDF and CSV outputs that matched the specified schemas — a critical operational win for busy school administrators.
UX and Teacher Adoption
Embedding analytics inside the workflow, rather than asking users to hop to a separate BI portal, materially improved adoption. Teachers could view attendance trends next to assessment grids; pastoral staff could layer behaviour incidents over term-by-term progress. Assembly added context-sensitive KPIs (for example, “attendance last 20 days” or “achievement trend by cohort”) and small, opinionated dashboards for common tasks. When analytics are kept contextual and limited to the decisions users need to make, adoption skyrockets — and embedding does exactly that.
Operational Outcomes and Measurable Benefits
- Faster Time-to-Insight: Principals reported being able to produce ad-hoc cohort reports in minutes instead of hours of spreadsheet wrangling.
- Lower Administrative Load: Automated Ministry returns and validated exports reduced manual checking and rework at term-end.
- Reduced Training Friction: Because the analytics appeared inside Assembly, training focused on “what to do” with insights rather than “how to use a new tool.”
- Better Local Decision-Making: Teachers used quick dashboards during staff meetings to identify students needing targeted interventions, shifting conversations from anecdotes to evidence.

Deployment Model and Operational Considerations
Assembly offered the InetSoft-embedded analytics as part of a hosted service to many schools while also supporting isolated school-hosted deployments where required. The mixed model respected school preferences around data hosting while still enabling centralized updates to dashboards and Ministry reports. Ongoing patching and schema updates were handled by Assembly’s operations team; InetSoft’s server was treated as a backend microservice that could be scaled independently of the core SMS traffic.
Challenges and Lessons Learned
No integration is frictionless. Early on, Assembly discovered edge cases around custom local fields used by some schools; the fix was to standardize a reporting layer mapping and ship an “extendable fields” pattern so bespoke attributes could be exposed safely to the analytics server. Performance tuning was another area of focus — pre-aggregating heavier measures and caching common dashboard queries gave the best balance between freshness and responsiveness. These are normal teething issues; the key is to design the reporting model so it tolerates local customization without breaking global reports.
Why This Matters for the Ministry and for Schools
Embedding InetSoft inside Assembly gave the Ministry and schools a practical pathway to consistent, auditable data insights without forcing schools to adopt separate analytics platforms. That alignment — a local SMS that meets New Zealand requirements, combined with an embeddable analytics engine — reduced friction around reporting, improved the quality of data-informed decisions at school level, and simplified the technical landscape for education IT teams. For a national ecosystem where many schools have limited IT capacity, that combination is not just convenient — it’s transformative.
In short, Assembly’s embedding of InetSoft delivered context-aware analytics, Ministry-ready outputs, and higher teacher adoption by keeping insights inside the school workflow. For any education product serving jurisdictions with complex reporting needs, embedding a lightweight, secure BI engine remains one of the cleanest ways to balance governance, usability, and scalability.

Other Applications for Embedded BI
- FinTech
- Marketing Automation
- Risk Management Analytics
- Sales Forecasting
- Web Analytics
- Travel and Expense Management
- Human Resources Management
- Ad Hoc Reporting
- Self-service Dashboard Creation
- Visual Data Exploration