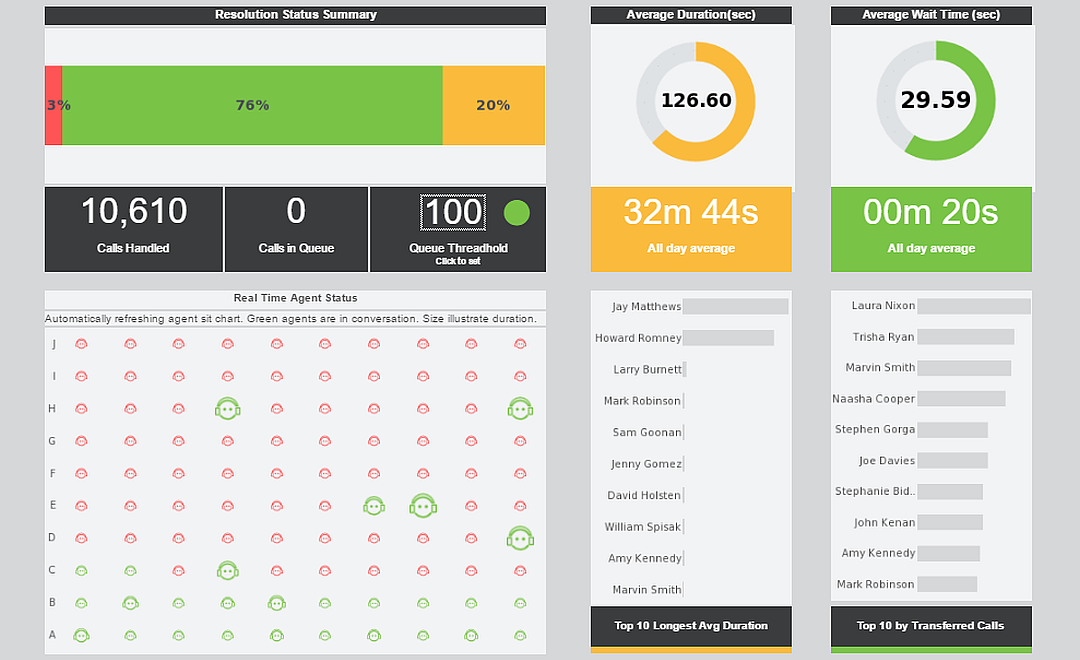
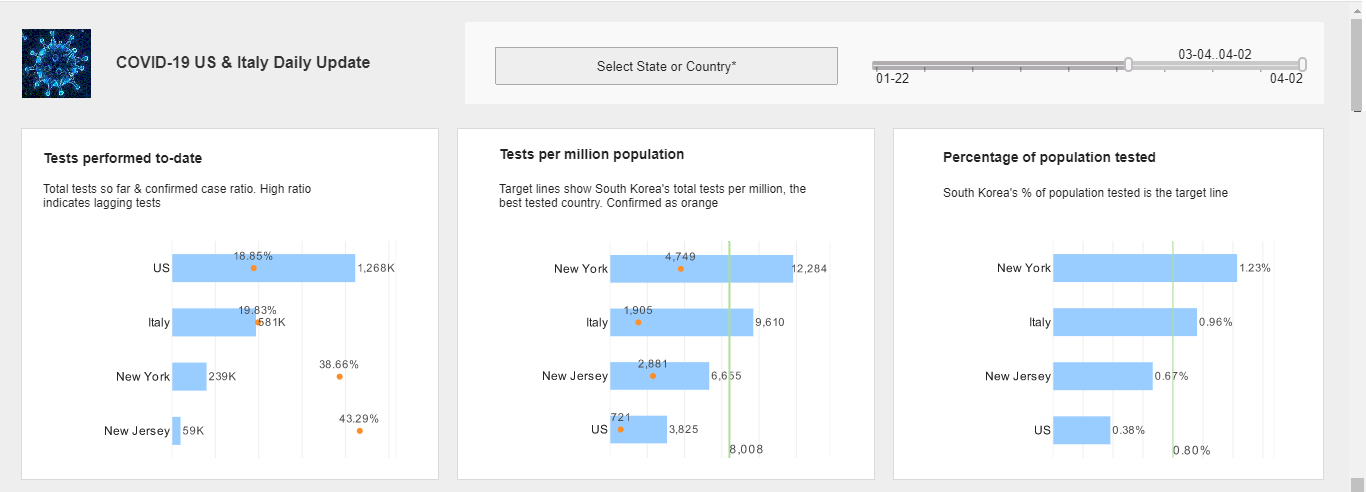
Flat File Dashboards and Excel Dashboard Analytics
Able to access almost any open standards data source (such as POJO and others), InetSoft's BI server can also access Excel spreadsheets, (file extensions .xls) or other flat files like .csv (comma separated value) and XML files.
InetSoft provides a good option if you are seeking to:
Build Interactive Dashboards
Excel is great for KPI calculations and serves as an easy ad hoc database for many departments. They can drive weekly or even daily performance management reporting from PowerPoint slides or macro-driven workbooks. But when you're ready to graduate to a proper Web-based dashboard platform with security-controlled shareability and accessibility from almost any device anywhere, then InetSoft's BI application can meet that need.
Or you may have a custom-built application, a Web service, or a system that does have open-standards based connectivity to its data store, and all you have are .csv or XML files and need to have simple or advanced dashboards and reporting. For InetSoft's BI application, connecting to a .csv file is the same as connecting to a spreadsheet. And with XML file, you can leverage the InetSoft API to build a custom connector to read your XML tags.
Build Mashups of Your Off-line Data and Other Enterprise Data
A key strength of InetSoft's business intelligence software is its depth of support for data mashups. Data from that spreadsheet sitting on your laptop, or the spreadmart on your LAN drive can be combined with almost any other data source found in your enterprise including: relational databases (via JDBC), multidimensional databases, XML, SOAP, Java beans (POJO), EJB beans, OLAP cubes, Hadoop/HIVE, SAP, PeopleSoft, Siebel CRM, Google AdWords & Analytics, JDE, salesforce.com and more.
In addition, InetSoft has innovated unique capabilities for enterprise mashups. You do not have to be a BI analyst to create your own mashups. Simply import your file and drag and drop similar fields to combine disparate tables and fields that were not previously mapped in a data model. Whatever dashboards or reports you make from them are now shareable inside the enterprise BI space.
Created Advanced Data Visualizations
StyleBI can give you the advanced data visualization types to be used on multi-dimensional data that Excel cannot. From bubble charts to heatmaps to radar plots, point and click visual anaylsis is the way to detect patterns and outliers and discover useful findings from mountains of data, especially big data. No other BI application provides more visualization types.
How a Gutter Cleaning Service Upgraded Its Dashboards and Analytics from Excel to StyleBI
Small businesses often operate on tight budgets and with limited technical resources, which makes lightweight, flexible tools like Excel the go-to solution for day-to-day reporting. For a Gutter Cleaning Service, Excel was initially sufficient: tracking jobs, customer invoices, and seasonal revenue trends could be handled with spreadsheets and basic charts. However, as the business grew, the limitations of Excel became apparent. The owner and operations team found themselves spending hours consolidating data, manually updating charts, and struggling to analyze trends across multiple crews and geographic areas. To gain better visibility and make data-driven decisions efficiently, the company decided to upgrade to an open-source analytics platform — StyleBI. The move from Excel to StyleBI not only transformed reporting and dashboards but also empowered the business to scale its operations while maintaining operational control and customer satisfaction.
Challenges of Relying on Excel
Excel is versatile and familiar, but it is not designed for dynamic, multi-source analytics. For the Gutter Cleaning Service, these limitations became increasingly problematic:
- Data Consolidation: Job schedules, invoices, employee hours, and client contact information were stored across multiple spreadsheets. Every month, the office manager spent hours merging these sheets to produce basic performance reports.
- Manual Error Risk: With multiple employees updating spreadsheets, inconsistencies arose. Missed entries, misaligned formulas, and duplicate data compromised accuracy and required constant verification.
- Lack of Real-Time Insights: Crew supervisors needed to know where teams were in the field, which jobs had been completed, and whether revenue targets were being met. Excel required offline data entry and manual updating, so managers were always looking at yesterday’s data.
- Limited Visualization: While charts and pivot tables were available, Excel could not provide interactive dashboards or drill-down capabilities to analyze performance at the crew, customer, or neighborhood level.
As the business expanded, taking on more clients and hiring additional crews, these limitations slowed decision-making and created operational friction. The owner recognized that to scale efficiently, a more sophisticated yet cost-effective analytics solution was required.
Why StyleBI Was Chosen
Several analytics platforms were considered, but the Gutter Cleaning Service selected StyleBI for several compelling reasons:
- Open-Source Flexibility: StyleBI’s open-source model allowed the company to deploy and customize the platform without paying high licensing fees, making it ideal for a small business with a modest IT budget.
- Unified Dashboards: The platform could consolidate multiple data sources — including job management software, employee timesheets, and invoicing systems — into a single dashboard for real-time monitoring.
- Self-Service Analytics: Crew supervisors and office staff could generate their own reports and visualizations without needing advanced technical skills, reducing dependency on the owner or external consultants.
- Scalability: StyleBI could grow with the business, allowing new data sources or metrics to be added without reconfiguring entire spreadsheets.
Implementation and Integration
The migration from Excel to StyleBI involved several key steps. First, the IT consultant helped map all the relevant data sources: Excel spreadsheets for historical job data, cloud-based scheduling tools, and the accounting system for invoices and payments. Using StyleBI’s connectors and data mashup capabilities, the consultant created a unified data model that automatically combined these sources into a central repository.
Once the data model was in place, dashboards were developed to meet the specific needs of different roles within the business:
- Owner Dashboard: Provided a high-level view of revenue trends, crew utilization, job completion rates, and client satisfaction metrics. Interactive visualizations allowed the owner to quickly spot underperforming areas or seasonal patterns.
- Crew Supervisor Dashboards: Displayed daily job assignments, real-time completion status, and crew efficiency. Supervisors could drill down to see which crew members were ahead or behind schedule and reassign tasks accordingly.
- Financial Dashboard: Combined invoicing and payment data to track outstanding balances, cash flow, and revenue by service type or neighborhood.
- Customer Insights Dashboard: Analyzed repeat business, customer feedback, and geographic distribution of jobs to identify areas for marketing or service expansion.
The open-source nature of StyleBI allowed the business to make minor customizations, such as color-coded visual indicators for overdue jobs or low customer ratings, creating intuitive dashboards that required minimal training.
Operational Benefits Realized
The shift from Excel to StyleBI had immediate and measurable benefits for the Gutter Cleaning Service:
- Real-Time Visibility: Supervisors could now see live updates of job status and crew locations. This allowed for dynamic reassignment of crews in response to weather changes or urgent customer requests.
- Time Savings: The time previously spent consolidating spreadsheets and updating charts was drastically reduced, freeing the office staff to focus on customer service and planning.
- Reduced Errors: Automated data consolidation and validation in StyleBI minimized manual entry errors and ensured that reports were always accurate.
- Enhanced Decision-Making: The owner could quickly identify underperforming crews, optimize routes, and make informed hiring decisions based on real-time operational metrics.
- Customer Satisfaction: Faster reporting enabled proactive communication with clients about scheduling, service completion, and follow-ups, enhancing the customer experience and driving repeat business.
- Cost Efficiency: By moving to an open-source solution, the business avoided recurring licensing fees and reduced dependence on external spreadsheet consultants.
Strategic Advantages
Beyond day-to-day operational improvements, the use of StyleBI positioned the business for strategic growth. The dashboards provided insights into seasonal demand patterns, helping the owner plan marketing campaigns and promotional offers during high-demand periods. Geographic analysis of completed jobs revealed underserved areas where additional crews could be deployed, supporting expansion planning.
Additionally, historical trend analysis enabled better resource forecasting. The business could now anticipate peak workload periods, hire temporary staff proactively, and manage inventory of cleaning equipment and materials more efficiently. By embedding predictive elements into dashboards, the company began exploring data-driven maintenance schedules and proactive customer outreach, transforming reporting from a reactive activity into a strategic planning tool.
Employee Engagement and Self-Service Analytics
One of the most significant cultural shifts from adopting StyleBI was empowering employees with self-service analytics. Crew supervisors no longer needed to request updated reports from the office manager; they could log into the dashboard and explore data relevant to their crews in real time. Office staff could generate financial summaries or client reports without involving IT or the business owner. This democratization of data fostered a sense of ownership among staff and reduced bottlenecks in information flow, creating a more agile, responsive business environment.
Implementation Lessons and Best Practices
The migration process highlighted several key lessons for other small businesses considering a move from Excel to a dedicated analytics platform:
- Start with Critical Metrics: Focus on the dashboards and KPIs that have the most impact on operations and growth. Avoid overwhelming users with too many visuals at once.
- Clean Your Data: Before integration, ensure that spreadsheets and legacy systems are accurate and consistent. Garbage in, garbage out applies even more in centralized analytics platforms.
- Engage Users Early: Involve staff in dashboard design to ensure the tools meet their workflow needs and encourage adoption.
- Leverage Open-Source Flexibility: Take advantage of customization options to create intuitive, role-specific dashboards without relying on expensive developers or consultants.
Future Directions
With StyleBI in place, the Gutter Cleaning Service is exploring additional ways to leverage its data. Potential initiatives include:
- Integrating weather forecast data to optimize scheduling and reduce missed appointments.
- Implementing predictive analytics to anticipate high-demand periods and allocate resources efficiently.
- Using geographic and customer behavior insights to plan targeted marketing campaigns and service expansion.
- Incorporating mobile dashboards for field crews to report status updates directly, further improving real-time visibility and operational efficiency.


