Financial BI Dashboard Software with Maximum Self-Service
Finance departments arguably face a wider set of information management challenges than any other department in an organization. Some of the challenges are common across functions, but several are specific to Finance.
From working with so many Finance teams across dozens of industry segments, including commercial, government, and non-profit ones, we have found many require not just a business intelligence solution, but a data intelligence solution, InetSoft's term for transforming data into actionable information.

Data Intelligence Challenges for Finance
Finance Departments face many challenges that interfere with gaining Data Intelligence:
1. A Multitude of Disparate Data Sources – Finance owns the accounting and financials data, but also needs to access data from every other function, from the CRM system, to the supply chain system, to the transactional and operational databases, and even marketing and HR systems. Outside of these is staff generated data stored in spreadsheets, whether they are forecasts, performance trackers, or special analyses. Ultimately all of this information needs to be mashed up to get the whole picture.
2. Limitations of Tabular Reports – The first generation of information reporting has been the tabular report, whether structured as in financial statements or essentially print-outs of a database. These are useful for presenting the facts, but not for telling the story. Not until those data dumps are imported into a spreadsheet, massaged into metrics, and turned into charts can analysts begin to tell stories about the data.
3. Too Many Reports – Relying on reports also leads to ever growing libraries of static reports as new ones are requested for each new question that comes up during the course of running the business. The libraries become overrun and disorganized, leading to potential confusion and errors, and certainly inefficiency.
4. Too Much Manual Reporting – Without self-service access to data, staffers make their own reports, importing, or even worse, copying and pasting data into spreadsheets and creating their own reports. This leads to more inefficiency, and worse: errors.
5. Spreadmarts – With operational data stores being so hard to change and not suited to key metric calculations and aggregations, finance staffers often resort to creating their own spreadsheet “databases.” No longer tied to the systems of record that might be updated over time, the result is competing versions of the truth.
6. Dependency on Data Scientists – the era of Big Data means there is an ocean of data that potentially could be analyzed, but most organizations don’t have the expertise to tackle the challenge.

InetSoft's Data Intelligence Solution for Finance
InetSoft provides a range of dashboard solutions, from software-only to turnkey cloud-based ones to customized ones in between that overcome these challenges. Foundational to all of them is InetSoft's core software application, which includes:
1. The Data Mashup Engine – Unlike other business intelligence applications, InetSoft's has a very flexible, very powerful data mashup engine that unites all of the data sources that the Finance team must access, from Big Data ones such as on-premise operational stores to cloud-based applications to transient sources like spreadsheets and vendor reports.
2. Interactive Dashboards and Visual Analyses – Geared towards maximum self-service, these are point-and-click views of the data, combining charts, tables and input elements that visually tell stories, replace the mess of static reports, and reduce the burden of future information requests.
Easy Implementation Options
Choose one of three options for deployment, all of which can be supplemented with InetSoft Big Data professional services to accelerate deployment:
1. On-premise Software Installation – for organizations that require the control and have the basic IT support to set up enterprise applications
2. Self-managed Cloud Hosting – InetSoft hosts the installation at Amazon (AWS), and the client’s IT staff administers it
3. Turnkey Cloud Service – InetSoft hosts the installation at AWS and performs all administration, and the client has self-service design capabilities
How a Haptic Interface Manufacturer Switched from Vena Solutions to StyleBI for Financial BI Dashboard Software
In the fast-evolving world of sensory technology, a Haptic Interface Manufacturer operates at the intersection of hardware precision, software integration, and user experience design. Such companies build the tactile backbone of modern devices—from the subtle vibrations in smartphone touchscreens to the sophisticated feedback loops in medical training simulators and virtual reality gloves. As this industry has matured, financial agility and data transparency have become just as critical as engineering prowess. For one mid-sized manufacturer of haptic interfaces, outdated financial processes built around Vena Solutions were limiting insight and responsiveness. The company’s leadership recognized that to sustain its growth and remain competitive, it needed a more flexible, open, and analytics-driven approach. That’s when the decision was made to switch to StyleBI, an open-source business intelligence platform optimized for real-time, self-service dashboards and enterprise data integration.
The Challenges with Vena Solutions
Vena Solutions provided the company with an integrated budgeting and forecasting framework, but over time, its finance and analytics teams began encountering serious constraints. The platform’s spreadsheet-like interface, while comfortable for accountants, became cumbersome for analysts who needed more flexible visualization and integration options. As financial data volume increased—driven by product diversification, international supply chains, and multiple R&D cost centers—performance and usability issues emerged. Several specific pain points pushed the company toward reconsideration:
- Rigid Architecture: While Vena’s Excel-based foundation was helpful early on, it imposed limitations on customization. Any structural change to templates or reports required technical intervention, slowing down analysis cycles.
- Limited Visualization: The platform offered basic reporting but lacked interactive dashboards and real-time visuals that could engage executives or highlight anomalies without manual effort.
- Data Silos: Financial data existed in isolation from operational metrics. The team struggled to connect information from manufacturing systems, inventory platforms, and customer analytics to generate holistic financial views.
- Licensing Costs: As the organization expanded, user-based licensing costs became burdensome, particularly for non-financial departments that only needed periodic access to dashboards.
- Integration Barriers: Integrating new data sources—such as production analytics or R&D cost tracking tools—often required external consultants or middleware, adding to the total cost of ownership.
Ultimately, while Vena Solutions remained a capable tool for structured budgeting and consolidation, it failed to meet the growing demands for interactive, department-spanning financial intelligence. The CFO and data analytics director jointly spearheaded an initiative to identify a platform capable of unifying finance and operations under a single, real-time BI environment. After evaluating several commercial options, including Power BI, Tableau, and Sisense, the team selected StyleBI for its open-source flexibility, cost efficiency, and adaptability to complex financial data workflows.

Why StyleBI Was the Right Fit
StyleBI’s architecture stood out because it could serve as both a financial dashboarding environment and a full-scale data mashup tool. The company was drawn to several distinctive features that aligned with its goals:
- Open-Source Licensing: Unlike traditional BI vendors that charge per user or data connection, StyleBI’s open-source model offered predictable and scalable cost structures, freeing up budget for development and analytics resources.
- Data Integration Power: StyleBI easily connected to the manufacturer’s ERP, CRM, and production databases, consolidating financial and operational data into unified dashboards without complex middleware.
- Self-Service Dashboarding: Finance and department managers could independently build and customize dashboards, reducing dependence on IT and accelerating reporting cycles.
- Interactive Analytics: Executives could drill down into line-item expenses, compare actuals versus forecasts, and explore trends across products or regions—all through responsive, browser-based interfaces.
- Automation and Real-Time Updates: Data refreshes occurred automatically through scheduled syncs, eliminating manual spreadsheet uploads and ensuring that everyone was working from the latest numbers.
Most importantly, StyleBI allowed for a design philosophy centered on transparency. Instead of confining analytics to finance professionals, the company could now democratize access—engineering managers, supply chain coordinators, and R&D directors all gained visibility into the financial impact of their actions. This marked a major cultural shift, enabling a data-informed approach across the entire organization.
Implementation: From Static Reports to Dynamic Intelligence
The migration process was carefully structured into three stages: data consolidation, dashboard development, and user onboarding. First, StyleBI’s data mashup layer connected the disparate systems that had previously required manual reconciliation. This included the general ledger from the ERP, inventory data from the warehouse management system, R&D cost tracking from project management software, and revenue data from the CRM. With all sources linked, the team established a centralized semantic layer where business logic—such as cost allocations, profit margins, and depreciation formulas—was defined once and applied universally.
Next came dashboard design. The finance team collaborated with StyleBI’s visual analytics toolkit to create a modular suite of dashboards tailored to each department:
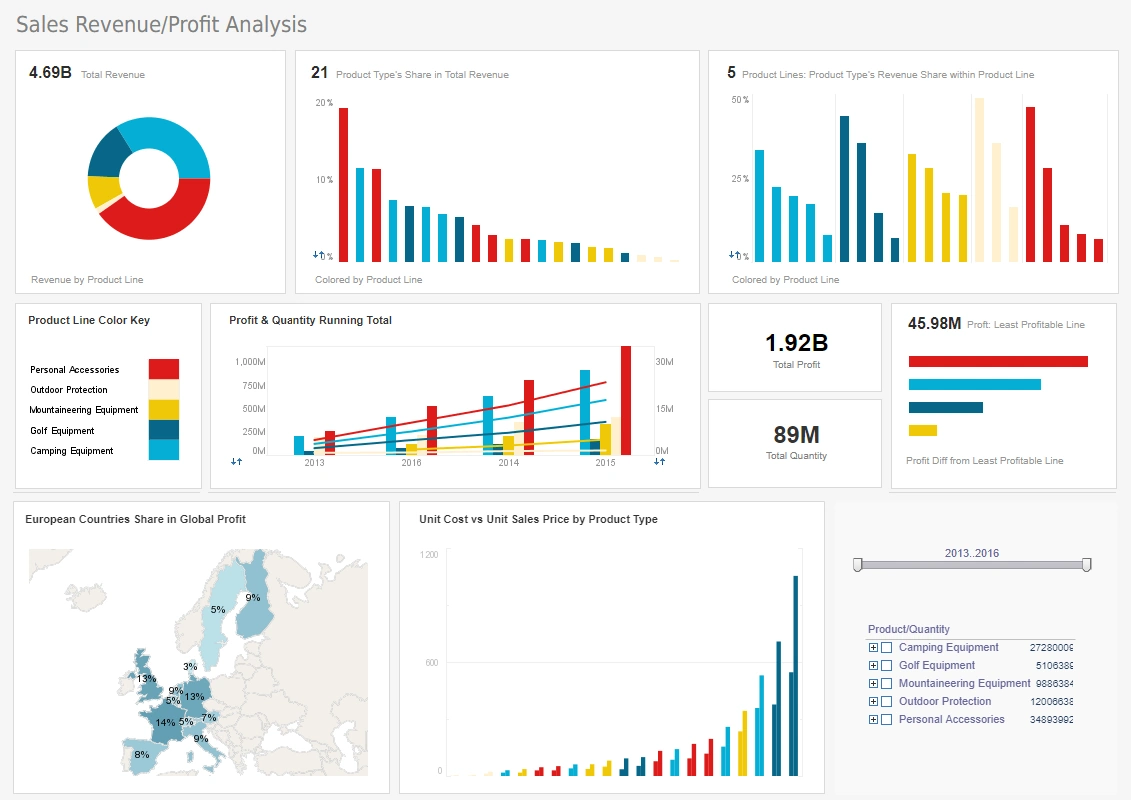
- Executive Overview Dashboard: Displayed real-time revenue, margin, and cost trends with drill-down functionality by region, product line, or business unit.
- R&D Expense Tracker: Linked project spending directly to budget allocations and progress milestones, enabling early identification of cost overruns.
- Production Cost Dashboard: Integrated financial and manufacturing data to analyze material usage efficiency, equipment downtime impact, and yield-related expenses.
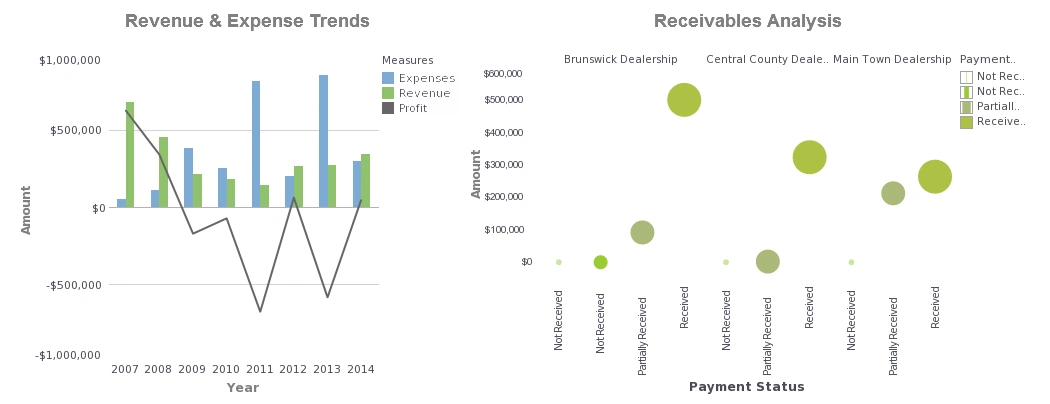
- Accounts Receivable & Cash Flow View: Monitored receivables aging, payment status, and working capital trends, improving liquidity forecasting.
- Profitability by Product: Merged sales and cost data to identify the contribution margin of each haptic product, guiding strategic pricing decisions.
Once the dashboards were tested and validated, StyleBI’s role-based access controls were implemented to ensure data security. Executives could see company-wide metrics, while department managers viewed only relevant financial details. The result was a cohesive environment where all users accessed the same data structure but through personalized, context-specific lenses.

Immediate Benefits and Operational Gains
After migrating to StyleBI, the Haptic Interface Manufacturer experienced a cascade of improvements across its financial and analytical operations:
- Faster Reporting Cycles: Monthly closings and forecast updates that previously took days now completed within hours, thanks to automated data integration and preconfigured visual templates.
- Real-Time Insight: Finance executives no longer waited for end-of-month reports; live dashboards provided up-to-the-minute visibility into performance metrics.
- Enhanced Accuracy: Automated calculations and centralized logic eliminated inconsistencies that plagued Excel-based and manually reconciled systems.
- Cross-Department Collaboration: With finance, R&D, and production teams sharing unified dashboards, discussions shifted from arguing about data accuracy to focusing on strategy and performance improvement.
- Scalable Flexibility: StyleBI’s modular architecture allowed the company to add new metrics, such as sustainability costs or supplier risk indexes, without reengineering existing dashboards.
- Cost Efficiency: By eliminating Vena’s licensing fees and consultant dependency, the company achieved a return on investment within the first year.
Quantifying the Impact
Within six months of deployment, the finance team reported measurable performance improvements. Financial report turnaround time dropped by 70%, forecasting accuracy improved by 15%, and overhead costs associated with financial analytics decreased by 40%. Moreover, the leadership team found that having integrated visualizations made board presentations and strategic planning sessions more effective. Instead of static slides, meetings now featured live dashboards that allowed scenario testing—what-if analyses for production costs, pricing strategies, and currency fluctuations—all in real time.
Broader Organizational Implications
Beyond finance, StyleBI sparked a broader shift toward data literacy within the organization. Engineering teams began using the platform’s visualization capabilities to monitor product test data alongside financial indicators, correlating production costs with performance yields. The marketing department integrated campaign data to measure return on investment alongside sales margins. As more departments adopted dashboards, StyleBI evolved into the company’s central decision-support platform, unifying financial accountability and operational strategy under one analytical roof.

Lessons Learned and Best Practices
The project offered valuable lessons for other advanced manufacturing companies considering a similar transition:
- Data Preparation Is Crucial: Clean, consistent data models ensured smooth integration and avoided the confusion of multiple definitions for financial terms.
- Empower End Users Early: Training finance and department heads on dashboard customization encouraged rapid adoption and reduced reliance on IT.
- Iterative Deployment: Rolling out dashboards in stages allowed for continuous feedback and quick refinement of KPIs and visual layouts.
- Prioritize Transparency: Establishing a single version of truth through centralized data logic built trust in the numbers, improving communication across departments.