PeopleSoft Dashboard Reports
In addition to accessing almost any open standards data source, InetSoft's BI application for dashboards, reports, and enterprise mashups can also access PeopleSoft data. InetSoft's BI solution is a good choice if you are interested in:
Upgrading Your Dashboards and Reports for Your PeopleSoft Applications
For any of the enterprise applications you may be using, you may wish for a greater level of interactivity or for more appealing look compared to the out-of-the-box dashboards and reports provided by PeopleSoft. InetSoft has pioneered the development of highly engaging, user-friendly HTML5-based visualizations and dashboards that are easy to develop and personalize.
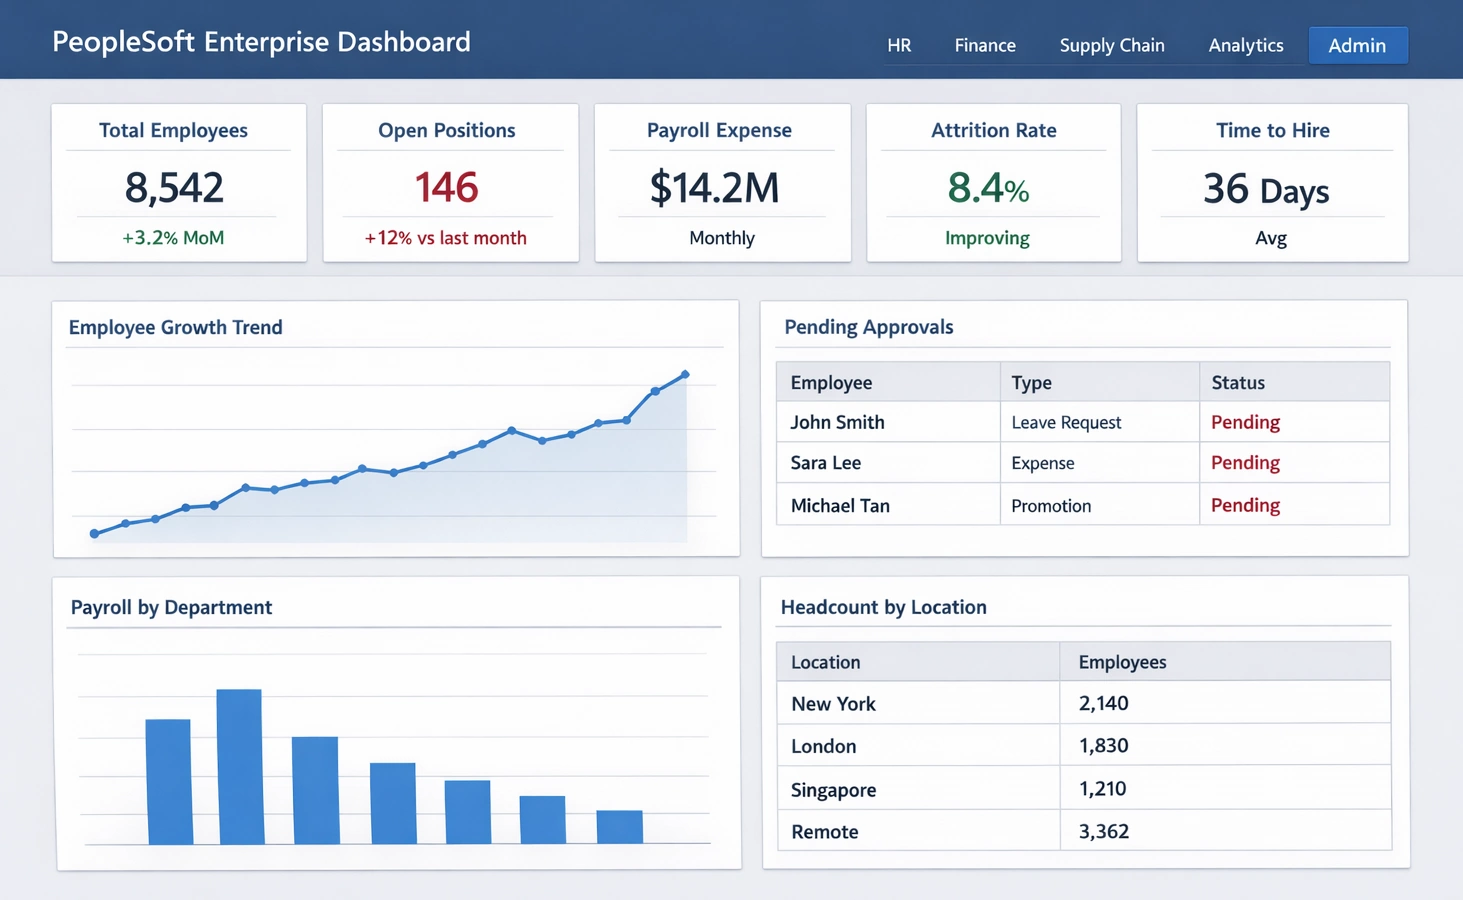
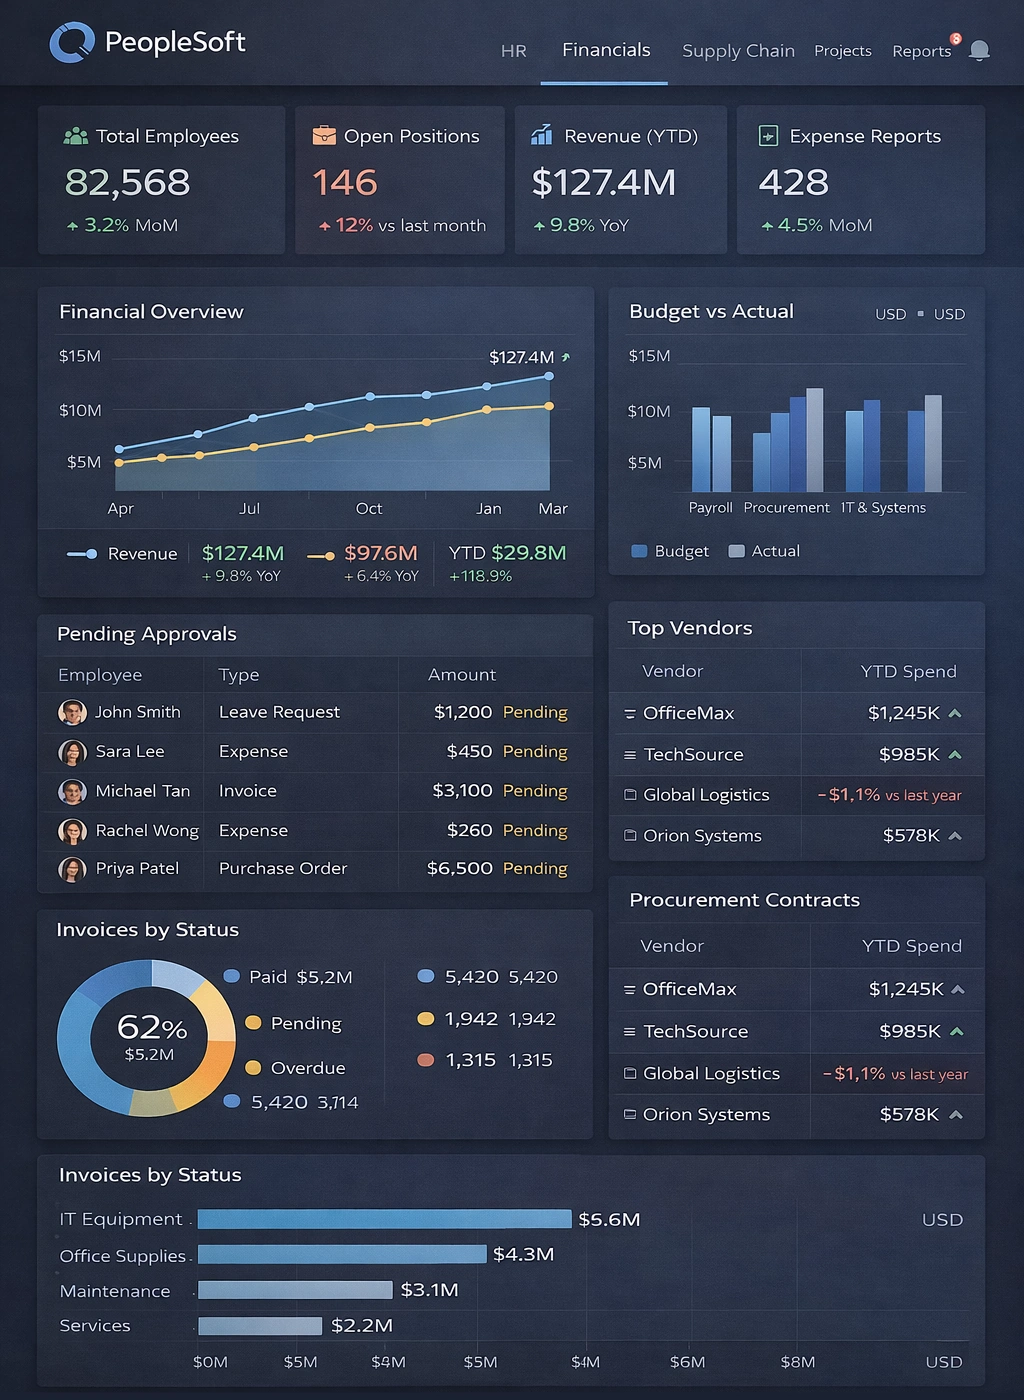
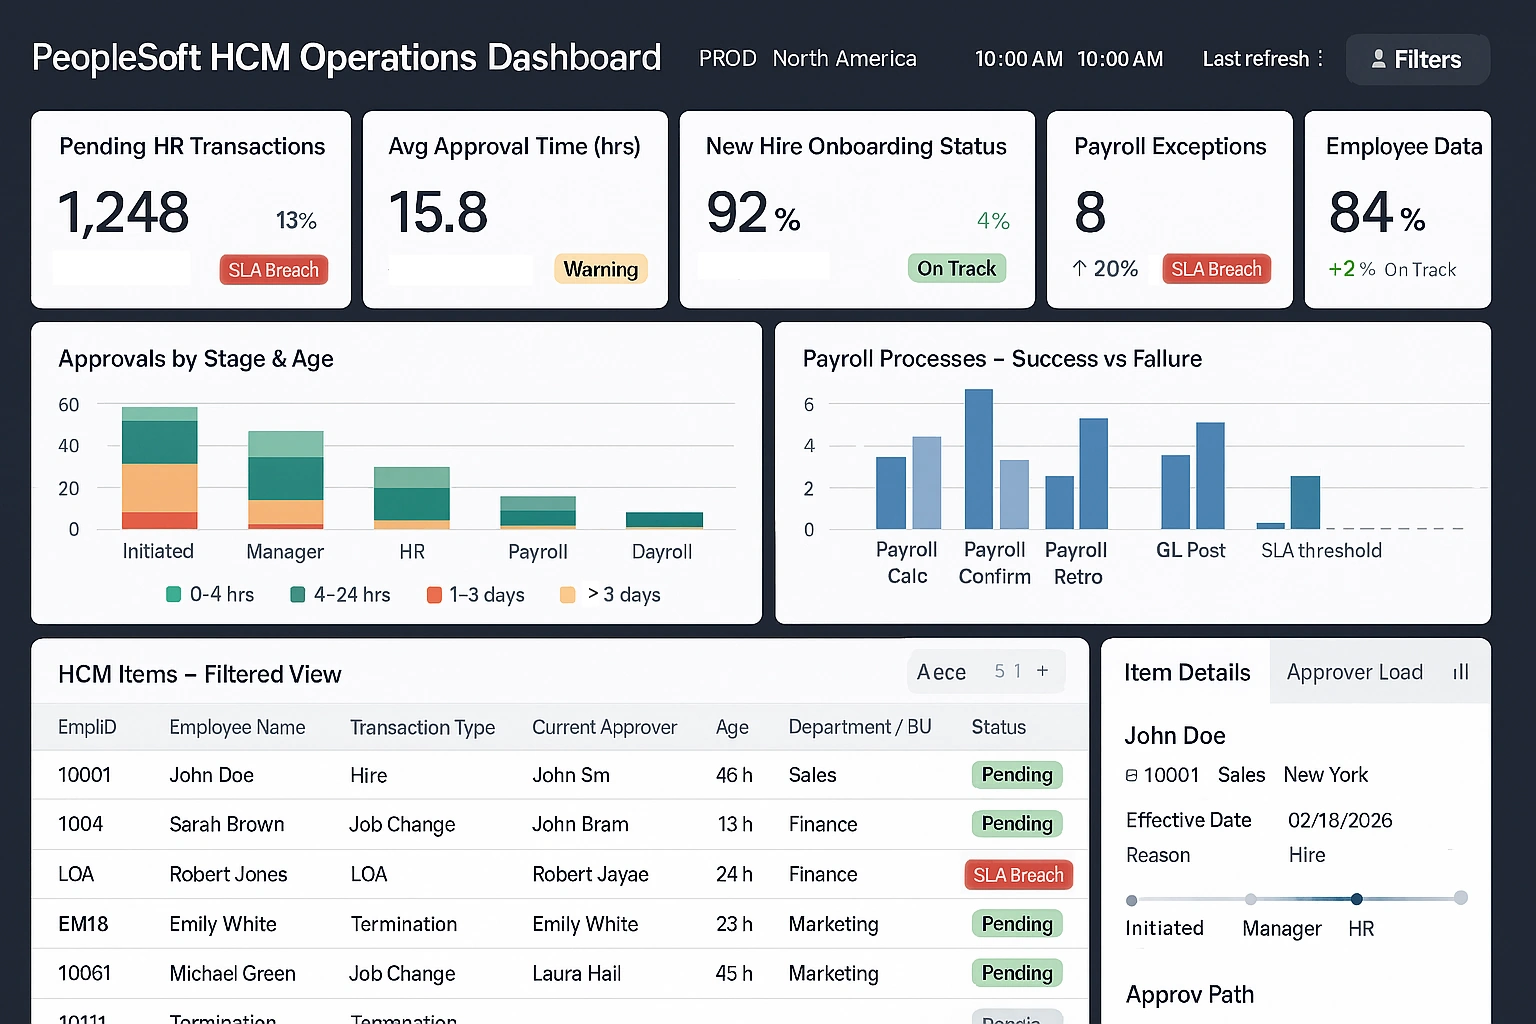
StyleBI is a small-footprint Java-based business intelligence server that enables rapid development and deployment of monitoring and analytical dashboards such as the example on the right.
Compared to the option of adding Oracle's Hyperion dashboard suite, InetSoft's solution should prove more agile, easier to learn and deploy, and more flexibly and affordably priced.


Building Data Mashups of Your PeopleSoft Data and Other Enterprise Data
A differentiation point for InetSoft's business intelligence software is its extensive support for data mashups. Data from your PeopleSoft applications can be combined with almost any other data source you have in your enterprise including: Relational databases (JDBC), Multidimensional databases, XML, SOAP, Java beans (POJO), EJB beans, flat files, CORBA objects, OLAP cubes, SAP, JD Edwards, Siebel CRM, and more.
InetSoft provides unique capabilities for enterprise mashups. Non-technical end-users can construct their own mashups with whatever data you allow them to, combining disparate tables and fields that have not been yet been pre-modeled for them. Users can also bring in their own data sets such as those in personal spreadsheets or those generated by vendors or partners and then make the resulting dashboards or reports shareable inside the enterprise BI platform.
Supported PeopleSoft Enterprise Applications
StyleBI can access data in any of the following PeopleSoft enterprise applications: Asset Lifecycle Management (ALM), Campus Solutions, Customer Relationship Management (CRM), Enterprise Performance Management, Enterprise Service Automation (Project Management), Financial Management, Human Capital Management, Supplier Relationship Management (Procurement), Supply Chain Management, and PeopleSoft Enterprise Tools and Technology (PeopleSoft PeopleTools Enterprise).
So whether it is providing better personnel performance dashboards, or creating a unified view of credit decisions, revenue recognition, cash receipts, and collections (i.e., delinquencies, deductions, and claims/disputes), you will be able to get the dashboards or reports your enterprise requires.
How a Identity Verification Device Manufacturer Upgraded Its Dashboards from PeopleSoft to StyleBI
When an Identity Verification Device Manufacturer decides to upgrade its operational dashboards from PeopleSoft to InetSoft’s open-source StyleBI, the change is about far more than a prettier UI. It’s a transformation of how data flows, how decisions are made, and how teams collaborate across engineering, manufacturing, quality, and customer support. PeopleSoft historically functions well as an ERP and HR system with embedded reporting, but it can be rigid and slow for ad-hoc analytics, real-time operational monitoring, and embedded visualizations required by a hardware manufacturer operating at scale. StyleBI brings a lightweight, embeddable BI layer, modern data mashup capabilities, and self-service visualization that better match the manufacturer’s need to correlate device telemetry, production PLC data, supply chain feeds, and field-support logs in near real time.
At the core of the migration is a redefinition of the manufacturer’s key performance indicators (KPIs). Where PeopleSoft reports tended to focus on transactional measures—purchase orders, payroll cost centers, and invoice aging—the new StyleBI implementation emphasizes operational KPIs that drive device quality and delivery performance. Examples include first-pass yield by product model, mean time between failures (MTBF) from field devices, time-to-resolution for firmware-related support tickets, supplier defect rate, and on-time delivery by warehouse. StyleBI’s KPI tiles and live gauges make these metrics visible at a glance on shop-floor dashboards and executive rollups alike.
Dashboards are organized by persona. The production floor benefits from a “Line Performance” dashboard that combines PLC cycle times, assembly station throughput, and defect counts per shift. Visual elements include stacked column charts for throughput by hour, sparklines for trend monitoring, and heat maps that highlight stations with elevated defect concentrations. Engineers can click into a defective batch and immediately view component lot numbers, supplier IDs, test bench telemetry, and the firmware build used during assembly—data that previously required multiple PeopleSoft extracts and manual joins.

Quality and Returns Dashboards
Quality assurance uses a “Quality and Returns” dashboard showing first-time pass rate, failure mode distribution, and return-to-vendor counts. Funnel charts visualize the lifecycle from incoming inspection to final test, and Pareto charts identify the most common root causes. StyleBI’s ability to mash up data from lab test systems, PeopleSoft quality tables, and the device-field telemetry store provides a single pane of truth for R&D and corrective action teams, enabling faster identification of systemic design or supplier issues.
Field support and product management use a “Device Health & Field Incidents” dashboard. This blends streamed telemetry (error codes, uptime metrics, sensor drift), CRM support tickets, and warranty claims to produce time-series anomaly detection charts and geospatial maps of incident hotspots. Scatter plots correlate firmware versions with incident rates, while cohort analyses show whether recent production runs or software releases have changed the field failure profile. These insights enable targeted firmware patches and prioritized recalls where necessary—actions that are hard to coordinate quickly in PeopleSoft’s batch-reporting model.
Supply chain and procurement stakeholders rely on a “Supplier Performance” dashboard. Line and bar charts show supplier defect rates, lead-time variability, and cost per component over time. Predictive indicators warn when a supplier’s lead time trend could jeopardize production schedules, and simulation widgets allow planners to test the effect of switching to alternative suppliers or adjusting safety stock. This level of scenario planning and what-if analysis is vastly more interactive in StyleBI compared to static PeopleSoft reports.

Planning of Data Integration
On the technical side, the migration requires careful planning of data integration and governance. StyleBI acts as a semantic layer that connects to PeopleSoft’s underlying database (for transactional data), to time-series stores for device telemetry, to MES/SCADA systems for shop-floor data, and to cloud-based CRM and support ticket systems. Data pipelines are built to normalize and enrich incoming streams, and data models are designed to preserve lineage so analysts can trace a KPI back to source records. Role-based access controls and SSO integration with the manufacturer’s identity provider ensure that sensitive IP, supplier contracts, and personnel data remain protected while enabling broad analytic access where appropriate.
Performance optimization is a critical implementation task. Device telemetry can generate very high cardinality time-series data; StyleBI’s caching strategies, aggregated materialized views, and pre-computed rollups reduce query latency for dashboards that need near-real-time updates. The system also supports hybrid architectures: hot-path dashboards query near-real-time stores directly for the last 24–72 hours, while cold-path historical analytics use a data lake or data warehouse. This separation keeps interactive dashboards snappy for shop-floor use while preserving deep historical analyses for six- and twelve-month trend work.
User adoption and change management are as important as the technical build. Engineers and operators are trained on self-service features so they can create ad-hoc queries, clone dashboards, and set threshold alerts without waiting on IT. A template library of pre-built dashboards—line performance, quality, supplier scorecard, field health—speeds adoption and provides consistent visual language. Governance policies specify when a dashboard becomes an “official” operational view versus a personal analytics sandbox, ensuring executive reporting maintains accuracy and trust.

Measurable Business Impacts
There are measurable business impacts from the switch. The manufacturer sees faster root-cause analysis cycles, fewer production stoppages due to earlier detection of bottlenecks, and reduced warranty costs driven by proactively addressing firmware- or component-related failures. Inventory turns improve as procurement can act on lead-time trends faster and more confidently. Support response times drop because analysts can correlate device telemetry with support tickets immediately, improving Mean Time To Repair (MTTR) and elevating customer satisfaction.
Security and compliance are integrated into the new BI workflows. Dashboards that include PII or supplier contract details are masked for non-authorized roles; audit trails track who accessed which dashboards and when. Integration with the existing identity management layer enforces least-privilege access, while data retention policies ensure telemetry and customer data are archived in line with regulatory requirements. For an identity device manufacturer—where security is core to product credibility—these governance features are non-negotiable.
Finally, the migration to StyleBI unlocks future opportunities. The vendor-neutral data mashup layer enables easy experimentation with embedded analytics in dealer portals, interactive reports for enterprise customers, and mobile dashboards for field technicians. Predictive maintenance algorithms and machine learning models can be embedded into dashboards to surface early warnings of component wear or manufacturing drift. By moving beyond PeopleSoft’s static reporting and embracing a flexible BI platform, the manufacturer not only improves current operations but also builds a foundation for data-driven product differentiation.