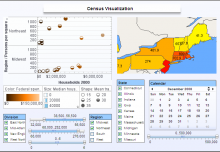
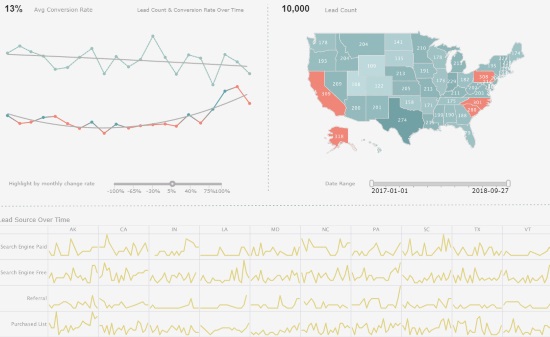
This page will discuss the uses of Sparkline Charts, show you how to create them in InetSoft, and provide access to a free online tool for creating Sparkline Charts as well as complete functioning business intelligence dashboards.


January 12, 2023

This page will discuss the uses of Sparkline Charts, show you how to create them in InetSoft, and provide access to a free online tool for creating Sparkline Charts as well as complete functioning business intelligence dashboards.