Business intelligence reporting newbies often have a hard time differentiating between reports and dashboards for good reason – reports and dashboards have many overlapping capabilities. Several years ago, the line between the two was clear. Reports were neatly organized static pages, while dashboards provided simple graphics with limited interactivity. But nowadays, the issue of what dashboard reporting tools to use and when to use them can be confusing for both designers and self-service end users. When placing data into either a report or dashboard, consider the following:
Audience and Action
First, determine who your audience is and what action you would like your audience to take. Every report or dashboard has an intended audience, whether it’s you, your department, your employer, or a group of shareholders. But, reports are geared toward presentation whereas dashboards are geared toward exploration. So, while dashboards might be appropriate internally since they allow staff to explore opportunities and areas for improvement and take action, reports may be more appropriate for shareholders who generally seek an overview of operations.
Presentation and Sharing
How do you plan to present and share your data with your audience? Web-based dashboards can be accessed via URL in a browser, where they may be employed to interactively explore underlying causes, correlations, and what-if scenarios. Reports however, can be exported into various static files including: PDF, XLS, HTML, CSV, XML, PPT, etc. – all of which are well suited for printing. Additionally, reports are better suited for pagination, whereas dashboards are better suited for concise single page presentations.
Timeliness and Interactivity
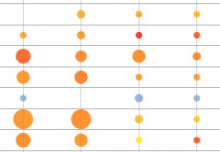
To be fair, both reports and data dashboard software can be designed to be interactive and provide the user with real-time access to selected data (note that reports must be viewed in a browser to be interactive). However, dashboards are better suited for interactivity since they are able to instantly update according to user selections. Reports on the other hand, must be regenerated in order to reflect user selections, which can be far more straining on network resources. But, note that reports can be made timely with minimal impact by using a scheduler to run the report at a select interval.
On a final note, it’s important to mention that you don’t always have to choose one format over the other. In fact, hyperlinks can be added to reports that allow users to view a related dashboard in a new window, and vice versa. Reports, dashboards, or both – the choice is yours.