Compress the Time Between Analytics Question and Answer
Below is the continuation of the transcript of a Webinar hosted by InetSoft on the topic of Machine Learning in Healthcare. The presenter is Abhishek Gupta, Product Manager at InetSoft, and the guest is Jim Reynolds, CTO at Health Analytica.
Abhishek: Right, well suffice to say it certainly sounds like you've been able to compress the time between analytics question and answer. This isn't a long term batch issue, and that allows investigation to take place where one answer to a question leads to the next question, and you can't get there rapidly without that process. So tell me a little bit about speed, not just speed of data but speed of investigation. How is your data science solution supporting that?
Jim: So one of the most difficult things to do it in investigation is if you imagine a dataset of a billion services, and that's a pretty good number of services. What I mean by service is when you go to the doctor, and they do a procedure, that's typically called a service, and when you have giant dataset of a billion or more of these services your job is to go figure out today which ten are bad.
That's a classic needle on a haystack. So what we've done is provided a risk management framework over the top of that where we have advance sensors in our data science platform that go and look for all these combinations of bad behaviors up in mass, and the analytics will run these things very, very fast, and they supply up all of the services which are highly questionable.
When we take the services that are highly questionable, and we run them through our risk framework to allow our calculation of what providers are engaging in the riskiest behaviors then how do they rank relative to other providers who maybe doing the same kinds of behaviors.
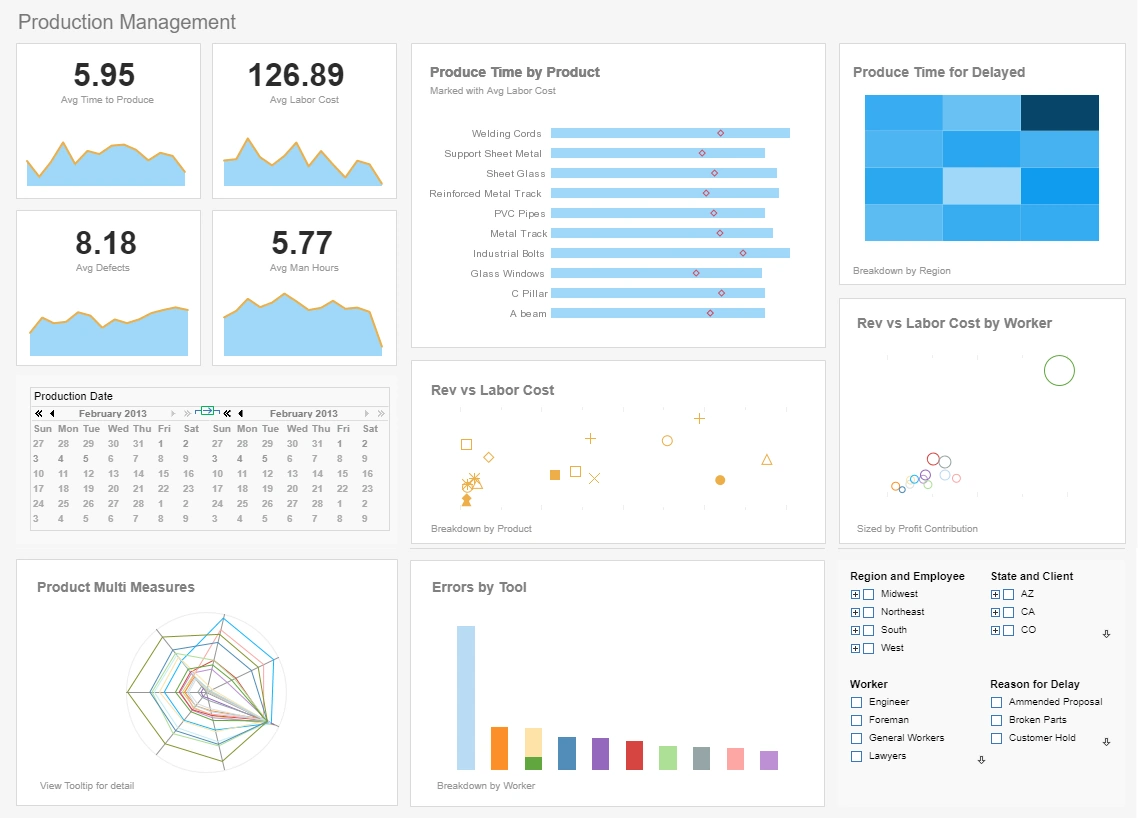

So from a user perspective I can go from a bucket of high risk providers, drill onto their metrics look at how they compare it to other providers and then drill all the way down into the exact services that shouldn't have been happening and be able to quantify what they are in a time series fashion, and we allow the user to do that in four clicks.
That's a significant time savings for an investigator because in the grand scheme, what typically happens is they just get a list of bad claims, and then they have to go figure out why are they bad and how am I going to go combat it. But we supply all this for them, and it just keeps crunching on these things on a continuous basis.
Abhishek: Right, how long, Jim, have you've been using the column store architecture behind HPE Vertica, and what did you use before that?
Jim: So we went on a journey like probably a lot of other data store technologies. We tried out a whole bunch of things, and originally when the problems were smaller a database like Postgres or some other open source MySQL, pick your favorite database, those were fine until we started reaching a certain type of scale and a certain type of query.
Then the challenges really started hitting people, and so we went on a journey of looking at the traditional column stores prior to things like Vertica and Cassandra. We looked at other graph databases. We looked at other massively parallel databases, and as we started moving through them. Either they were really, really expensive to maintain, really hard to set up, or very difficult to make highly available.
As we started building that criteria out and swapping out the technology, we found Vertica, and we were able to satisfy the most number of requirements from our scale and speed up, but we were also able to do it with a very small number of nodes in comparison to other database technologies, and that was a big deal for us.
We did not have to build out a giant multi hundred node data store to get the performance that we needed, and for us that was a big deal. In addition to that Vert ica is extremely manageable, easy to manage technology, and those were all things that we really liked, and these were all things that we really liked, and it has been for us an extremely cost effective store for our column store.

Abhishek: That makes sense — so given Vertica's advantages, how has that changed your team's day-to-day workflow for exploratory analysis and model iteration?
Jim: It has shortened the feedback loop dramatically. Analysts and data scientists can run ad-hoc cohorts and pivot feature definitions on production-sized datasets in minutes instead of hours, which lets us iterate models faster, validate hypotheses more reliably, and promote promising work into validation and deployment much sooner.
Abhishek: That speed must also affect operational priorities — are you finding you can reallocate effort from heavy engineering tasks toward higher-value activities like model refinement and investigative analytics?
As organizations work to compress the time between an analytics question and its answer, one of the most effective strategies is reducing friction in data discovery. When users can quickly locate trusted datasets, understand their lineage, and evaluate their relevance, they spend far less time searching and far more time analyzing. Modern BI platforms support this acceleration through searchable data catalogs, embedded metadata, and intuitive semantic layers. These capabilities help analysts move directly from a question to exploration without waiting on IT, making self‑service discovery a foundational enabler of rapid insight generation.
Another way to shorten the analytics cycle is by automating repetitive data preparation tasks. Many organizations still rely on manual cleansing, transformation, and enrichment steps that slow down analysis and introduce inconsistencies. Automation tools can detect schema changes, standardize formats, and apply reusable transformation logic across datasets. When these processes run continuously in the background, analysts receive ready‑to‑use data the moment they need it. This shift from manual wrangling to automated pipelines dramatically reduces turnaround time and strengthens data preparation efficiency across the enterprise.

Embedding analytics directly into operational workflows also compresses the question‑to‑answer timeline. Instead of requiring users to switch applications or run separate reports, insights can appear contextually within CRM systems, ERP interfaces, or custom business applications. When frontline employees receive real‑time metrics or recommendations at the moment of decision, they no longer need to pause their work to search for answers. This integration transforms analytics from a separate activity into a seamless part of daily operations, reinforcing the value of embedded BI for speed and agility.
Organizations can further accelerate analytics by adopting event‑driven architectures that deliver insights as soon as relevant data changes. Real‑time streaming pipelines allow dashboards, alerts, and predictive models to update instantly when new transactions, sensor readings, or customer interactions occur. This eliminates the delays associated with batch processing and ensures that decision‑makers always operate with the freshest information. Event‑driven analytics is especially valuable in environments where timing is critical—such as logistics, financial services, and public safety—making real‑time insight delivery a key differentiator.
Finally, compressing analytics timelines requires cultivating a culture that encourages rapid experimentation. When teams feel empowered to test hypotheses, iterate on dashboards, and refine metrics without bureaucratic barriers, insights emerge much faster. Lightweight governance frameworks can support this agility by defining clear guardrails while still allowing flexibility. Encouraging collaboration between business users and data teams also helps surface questions earlier and resolve them more quickly. Over time, this culture of fast iteration becomes a strategic asset, enabling organizations to respond to change with confidence through agile analytics practices.