Do You Find Self-hosted BI Is Cost Prohibitive?
Bring BI software to your data to deliver real-time data and high performance
InetSoft allows you to choose hosting without a huge cost penalty over vendor hosting
Highly rated and trusted by 5,000+ customers and partners since 1996


Essential Features for Self-hosted BI
Free Best Practice Guidance
Backed by real-world experience, we will help you speed up your deployment
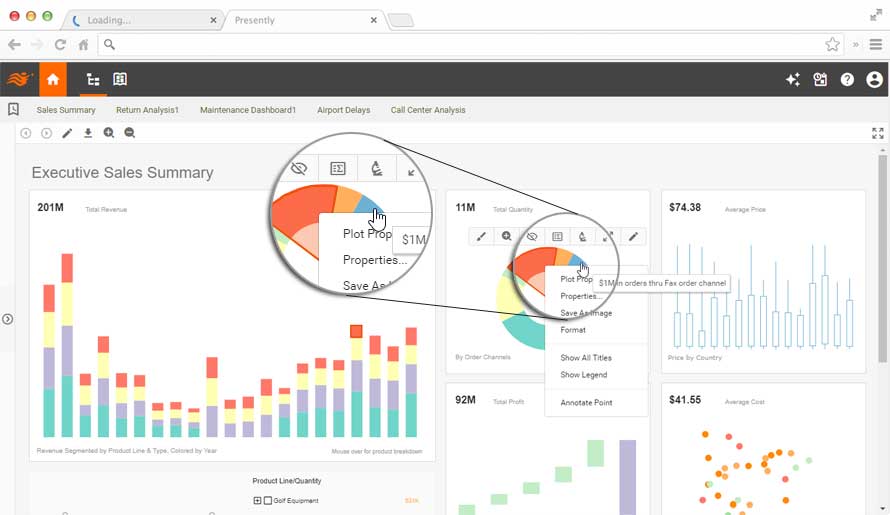
End Users: Interactive Dashboards with Rich Customization and Self-Service
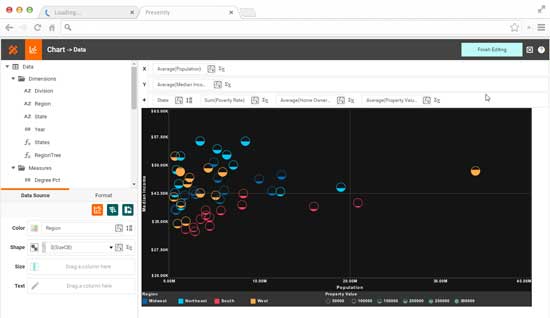
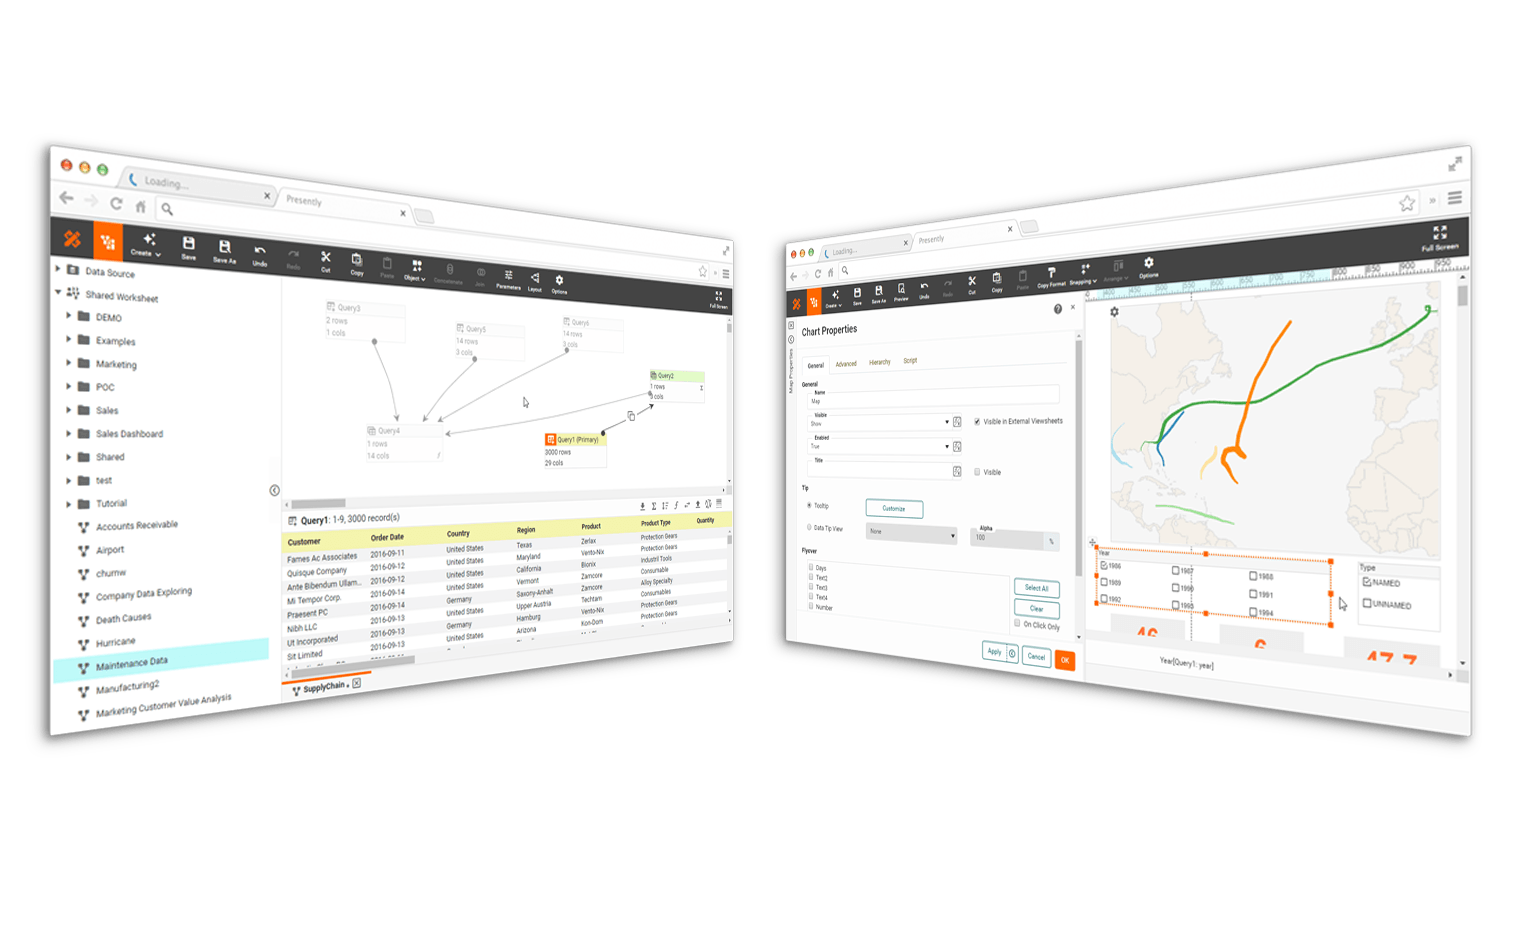
Designers: Rapidly Prepare Data and Design Dashboard Reports
Reasons Why Customers Chose InetSoft
"What I liked the most was the drag-and-drop feature for putting together a data query. With other solutions you have no choice but to sit and write code, but with StyleBI, it doesn't take two to three hours to design reports. You only need ten to fifteen minutes." - Business Intelligence Manager at NCN
"One of the biggest benefits we see with this product is our ability to react more quickly to potential problems that affect our bottom line by alerting us to crucial information on a real-time basis. This will allow us to respond very quickly to opportunities and take a more proactive approach to management." - GM of South Operations and Director of Research at ILS
"For end-users of our application, such as clinicians and hospital administrators, who are not business intelligence experts, interacting with, and even designing new report templates had to be intuitive and user-friendly, and InetSoft has accomplished that hands down." - President of TNC
Why StyleBI Makes a Better Self‑Hosted BI Choice Than Tableau, Looker, and Power BI

Deployment Freedom and Data Ownership
- StyleBI offers true self‑hosting without restrictions — Unlike Tableau and Power BI, which push users toward cloud‑centric ecosystems, StyleBI provides full on‑premises deployment with no dependency on proprietary cloud services. This gives organizations complete control over infrastructure, data residency, and security posture.
- Looker cannot be self‑hosted at all — Looker is fully cloud‑native and tied to Google Cloud’s architecture. Companies requiring private networks, air‑gapped environments, or strict compliance frameworks cannot deploy Looker locally, making StyleBI the only viable option among the four.
- StyleBI supports flexible infrastructure choices — Organizations can deploy on Linux, Windows, VMs, containers, or private cloud environments. Tableau Server and Power BI Report Server have narrower compatibility and more rigid hardware requirements.
- Fewer architectural constraints — StyleBI does not require Azure, Google Cloud, or AWS. It runs anywhere the organization chooses, supporting hybrid and private‑cloud strategies.
- Better for organizations wanting full data ownership — StyleBI ensures all data, metadata, and analytics assets remain entirely within the organization’s environment. Competing platforms store metadata or telemetry in vendor clouds.
- No dependency on proprietary data formats — Tableau extracts and Power BI PBIX files lock users into proprietary formats. StyleBI uses open, database‑driven models that avoid vendor lock‑in.

Security, Governance, and Compliance
- No forced cloud identity systems — Power BI requires Azure AD for authentication, and Looker requires Google identity services. StyleBI integrates with any SSO provider, including LDAP, SAML, and custom identity systems, without forcing a cloud identity migration.
- Better governance for self‑hosted environments — StyleBI provides granular permissions at the dataset, field, visualization, and tenant levels. Tableau and Power BI have more rigid permission models, and Looker requires LookML engineering for governance.
- Ideal for regulated industries — Healthcare, finance, government, and manufacturing organizations choose StyleBI because it supports full on‑prem compliance, auditability, and data isolation. Looker cannot meet these requirements due to its cloud‑only nature.
- Better for air‑gapped or restricted networks — StyleBI runs without internet access. Tableau and Power BI require periodic online validation, and Looker cannot run offline at all.
- More control over update cycles — StyleBI allows organizations to choose when to upgrade. Power BI and Looker push frequent cloud updates that can break workflows or introduce unwanted UI changes.

Cost, Licensing, and Scalability
- Lower total cost of ownership for large user bases — Tableau and Power BI charge per user or per capacity tier, which becomes expensive for broad deployments. StyleBI’s licensing model supports unlimited or high‑volume user access without exponential cost increases.
- Ideal for organizations with external users — StyleBI allows unlimited customer, vendor, or partner access without per‑viewer fees. Tableau and Power BI impose strict licensing rules that make external sharing costly and complex.
- More predictable scaling — StyleBI scales horizontally without requiring premium cloud capacity tiers. Power BI Premium and Tableau Server require expensive upgrades for higher concurrency.
- More transparent pricing — Tableau and Power BI have complex licensing structures with hidden costs for external users, embedding, and scaling. StyleBI offers straightforward licensing aligned with self‑hosted deployments.

Embedding, OEM, and Multi‑Tenant Product Use
- White‑labeling is native and unrestricted — StyleBI allows full rebranding of the BI environment, including logos, color schemes, navigation, and embedded components. Tableau and Power BI offer limited customization, and Looker requires heavy engineering effort to approximate white‑labeling.
- Superior embedded analytics flexibility — StyleBI provides seamless embedding with full API control, custom styling, and multi‑tenant isolation. Power BI embedding requires Azure capacity licensing, while Tableau embedding still exposes Tableau UI elements.
- Multi‑tenant architecture built in — StyleBI supports tenant isolation at the data, metadata, and visualization layers. Tableau and Power BI require complex workarounds, and Looker requires LookML engineering to simulate multi‑tenancy.
- Better suited for OEM and product integration — Software vendors embedding analytics into their products prefer StyleBI because it avoids cloud lock‑in, per‑user licensing, and UI limitations. Tableau and Power BI are not OEM‑friendly.
- Cleaner embedding for customer portals — StyleBI embeds as a native component with no visible third‑party branding. Tableau and Power BI embed with recognizable UI elements that cannot be fully removed.
- More flexible customization options — StyleBI allows custom CSS, JavaScript, and UI extensions. Tableau and Power BI offer limited customization, and Looker requires engineering‑heavy extensions.
- Designed for enterprise embedding and multi‑tenant SaaS — StyleBI is widely used by SaaS vendors and enterprises building customer‑facing analytics. Tableau and Power BI are primarily internal BI tools.

Analytics Capability and Long‑Term Maintainability
- Unified environment for dashboards and data mining — StyleBI integrates visualization with deeper analytical exploration. Tableau and Power BI focus on visualization only, while Looker relies on SQL‑centric modeling without native mining tools.
- Faster root‑cause analysis workflows — Users can drill from KPIs into correlations, patterns, and detailed data mining without switching tools. Competing platforms require exporting data to Python, R, or external tools for deeper analysis.
- Better performance with large datasets — StyleBI’s query optimization and caching engine handle high‑volume, high‑cardinality data more efficiently than Tableau extracts or Power BI’s in‑memory model. Looker depends entirely on the underlying database for performance.
- Supports complex data blending without rigid cubes — StyleBI blends live data sources dynamically. Power BI requires dataflows or semantic models, and Tableau requires extracts for many blending scenarios.
- Better suited for long‑term data strategy — StyleBI’s open architecture, flexible deployment, and extensible metadata model support evolving analytics needs without forcing a migration to a vendor cloud ecosystem.
- Better alignment with open standards — StyleBI avoids proprietary scripting languages like LookML or DAX. It uses SQL and open metadata structures that are easier to maintain.
- More efficient for distributed teams — StyleBI’s web‑based designer allows collaborative dashboard creation without desktop software. Tableau requires Tableau Desktop for many tasks, and Power BI requires Power BI Desktop.
- Superior long‑term maintainability — StyleBI’s architecture avoids the fragmentation seen in Power BI (Desktop, Service, Report Server) and Tableau (Desktop, Server, Prep). Everything is unified in one platform.