A Cloud-Flexible Solution for Marketing Dashboards
Do you need the flexibility to run your marketing dashboards in a cloud environment that is closer to your data source? Many competitive options force you to host your dashboards in their own cloud infrastructure which can lead to delays and higher costs in querying your marketing database(s).
InetSoft permits you to run our software in the private or public cloud of your choosing. You also have the option to deploy the software on-premise. All new clients and partners get free one-on-one business intelligence expert help to accelerate deployment.

| #1 Ranking: Read how InetSoft was rated #1 for user adoption in G2's user survey-based index | Read More |
How Do Marcom Professionals Use Dashboards?
-
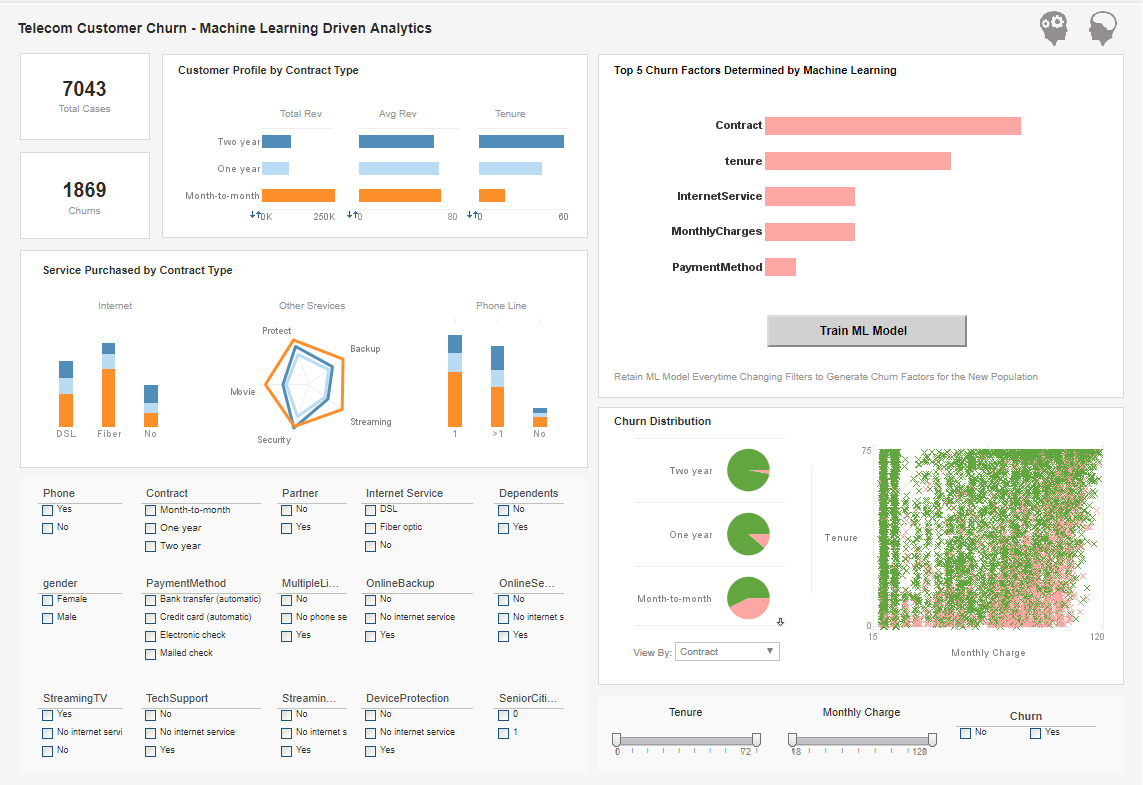
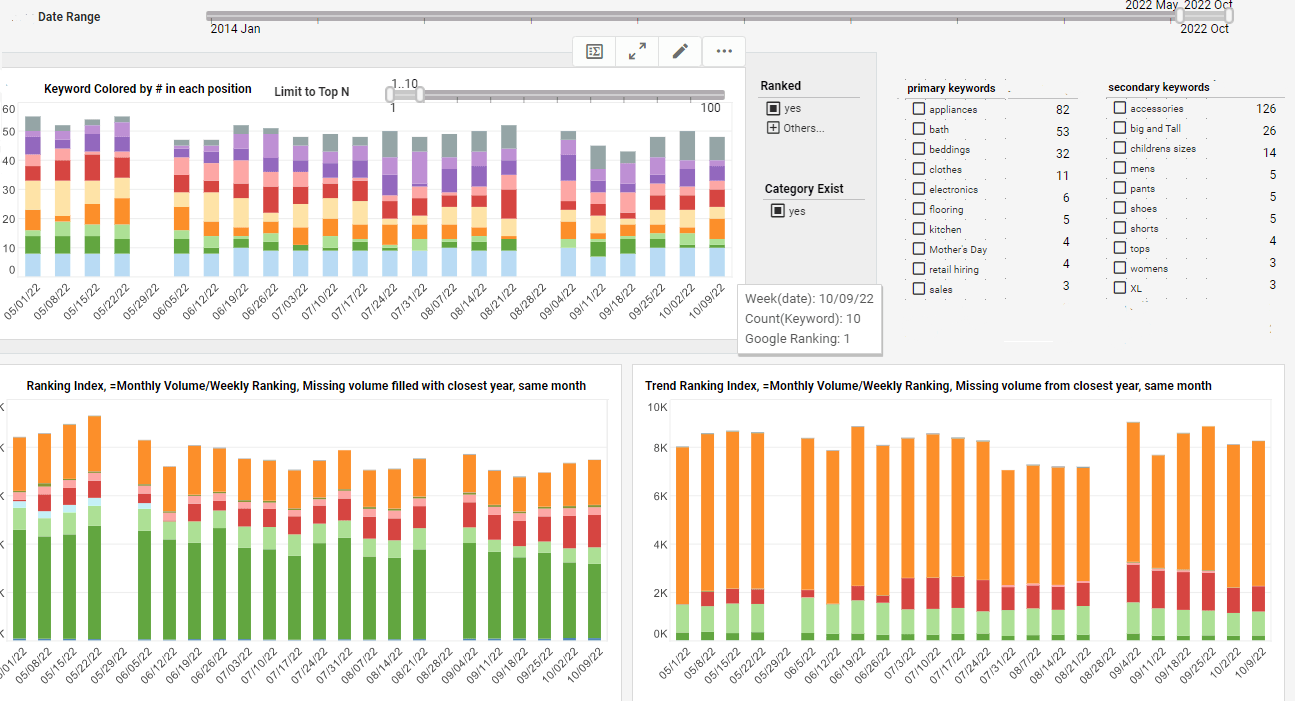
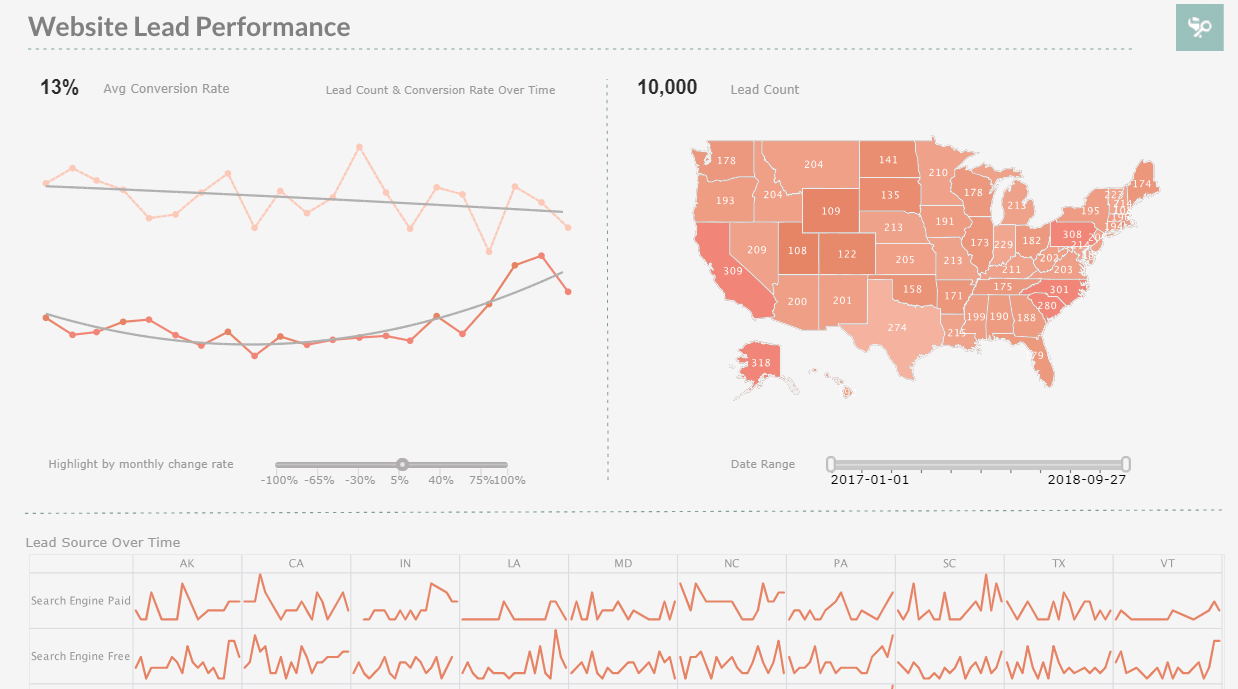
Performance Tracking: Dashboards enable marcom professionals to track key performance indicators (KPIs) related to their marketing campaigns. These KPIs may include website traffic, conversion rates, email open rates, social media engagement, and more. By monitoring these metrics on a dashboard, marketers can assess the effectiveness of their marketing efforts and identify areas for improvement.
-
Campaign Analysis: Dashboards help marcom professionals analyze the performance of specific marketing campaigns. They can track campaign metrics such as reach, impressions, clicks, conversions, and return on investment (ROI). By comparing data across different campaigns, marketers can identify successful strategies, pinpoint underperforming areas, and make data-driven adjustments to optimize future campaigns.
-
Data Consolidation: Marketing activities generate vast amounts of data from multiple sources such as social media platforms, web analytics tools, email marketing software, and CRM systems. Dashboards allow marcom professionals to consolidate this data from different sources into a single, centralized view. This consolidation simplifies the process of data analysis and eliminates the need to manually gather information from various platforms.
-
Real-time Monitoring: Dashboards provide real-time updates on marketing performance. Marcom professionals can monitor live data to observe trends, spot anomalies, and respond promptly to emerging opportunities or issues. Real-time monitoring allows for agile decision-making and the ability to adjust marketing strategies on the fly, maximizing the impact of marketing campaigns.
-
Visual Reporting: Dashboards offer visually appealing and interactive reports that facilitate communication and collaboration within marketing teams and with other stakeholders. These reports can be customized to showcase specific metrics, trends, and benchmarks, making it easier to present data-driven insights to management, clients, or colleagues. Visual reporting helps to simplify complex data sets and communicate marketing performance in a concise and understandable manner.
-
Goal Tracking: Dashboards allow marcom professionals to set goals and track progress towards achieving them. By establishing specific targets for key metrics, marketers can measure performance against those goals and adjust their strategies accordingly. Dashboards provide a clear overview of goal attainment, making it easier to identify areas where efforts need to be intensified or modified.
What Dashboards Do PR Managers Use ?
-
Media Monitoring: Dashboards can aggregate data from media monitoring tools, allowing PR managers to track mentions, sentiment analysis, and media coverage across different channels. By monitoring media activities in real-time, PR managers can identify emerging trends, respond to news coverage promptly, and assess the overall sentiment surrounding their brand or organization.
-
Coverage Analysis: Dashboards enable PR managers to analyze the reach and impact of their media coverage. They can track metrics such as the number of impressions, reach, share of voice, and media outlet performance. By visualizing this data on a dashboard, PR managers can identify high-performing channels, measure the effectiveness of PR campaigns, and assess the overall visibility of their brand or key messages.
-
Reputation Management: Dashboards allow PR managers to monitor and manage their brand's reputation. They can track online sentiment, customer feedback, and social media mentions to gauge public perception. By monitoring reputation metrics on a dashboard, PR managers can identify potential issues, address negative sentiment, and take proactive measures to maintain a positive brand image.
-
Crisis Management: Dashboards play a crucial role in crisis management for PR managers. During a crisis situation, PR managers can use dashboards to monitor real-time data, track media coverage, and assess public sentiment. Dashboards provide a centralized view of critical metrics, helping PR managers to make informed decisions, allocate resources effectively, and monitor the progress of crisis communication efforts.
-
Stakeholder Engagement: Dashboards can integrate data from social media platforms, email marketing campaigns, and website analytics to measure stakeholder engagement. PR managers can track metrics such as social media engagement, email open rates, website traffic, and conversion rates. By visualizing these engagement metrics on a dashboard, PR managers can evaluate the effectiveness of their communication strategies and identify opportunities to deepen engagement with key stakeholders.
-
Reporting and Measurement: Dashboards simplify the reporting process for PR managers. They can create customized reports that showcase key metrics, campaign performance, and media coverage. Dashboards enable PR managers to present data-driven insights to internal stakeholders, executives, and clients in a visually appealing and easily digestible format.
 |
View live interactive examples in InetSoft's dashboard and visualization gallery. |
More Resources for Creators of Marketing Dashboards
14 Metrics to Use in a Marketing Dashboard - Below are more specific online marketing metrics that should be in a marketing dashboard: 1. Traffic metrics: A good dashboard should help you to measure your website traffic in different ways, including impressions and visitors per hour, day, week, month, etc. It will also show where the visitors are coming from. This should include information like...
Accessing Web Service Data Sources - Looking for reporting tools for accessing a data sources as a Web service? InetSoft offers Web-based BI software that can access almost any data source including Web and XML feeds or API-based data sources. Data Warehousing BI Roadmap - You know I've heard this so long before, and it scares me a little bit that we are leaving out this discussion the reason of why the business is asking for this. It's amazing how MDM is following the data warehousing BI roadmap. I am old enough but I remember the days when IT said, we build the data warehouse, and the business users will come and use our data and do all these analytics and all that good kind of stuff...
Customer Retention and Loyalty Metrics - Marketing operations analysts use the following KPIs and data to assess client loyalty and retention: Customer Churn Rate: The proportion of customers that end their association with a business during a certain time period is calculated as churn rate. It helps in evaluating attempts to retain customers and the general status of customer relationships...
Dashboard for Monitoring Global Network Performance - A dashboard for monitoring an enterprise's global network performance must access many data sources. And InetSoft, a premium BI software vendor, offers an application that handles big data with ease. Some of the features of the InetSoft flagship product, StyleBI, were made to deal with problems specific to wrangling overly-large, often diverse and disparate, data sources...
 |
Read how InetSoft saves money and resources with deployment flexibility. |
Do You Need a Custom eCommerce Dashboard? - It ought to be noticed that there are a couple of ways of moving toward the matter, in view of where you are in the beginning of your web-based store. Assuming you utilize an eCommerce stage, such as Shopify, BigCommerce or Magento, you are probably going to select an explicitly evolved application or instrument that is at first intended to be viable with your foundation of decision...
Evaluate InetSoft's Vendor Management Dashboard Tool - Are you looking for a good tool to make a vendor management dashboard? InetSoft's pioneering dashboard reporting application produces great-looking web-based dashboards with an easy-to-use drag-and-drop designer. Get cloud-flexibility for your deployment. Minimize costs with a small-footprint solution. Maximize self-service for all types of users. No dedicated BI developer required. View a demo and try interactive examples...
Good Apache Business Intelligence Tool - Are you looking for a good business intelligence tool to run on Apache? InetSoft's pioneering dashboard reporting application produces great-looking web-based dashboards with an easy-to-use drag-and-drop designer. Maximize self-service for all types of users. View a demo and try interactive examples. The flexibility of StyleBI provides many analysis abilities that traditionally would have required a data warehouse. Data warehouses can be added...
Having Mastered BI Tools to Deliver Reports - And when you get right down to it, I think reports really are the jumping-off point for analytics. Many of us have mastered how to use our data warehouses in our BI tools to deliver reports to users. That's really the first step to move beyond reporting, which a lot of us now want to do, to deliver more value to the business, to exploit this information resource we so painstakingly built...
 |
Learn about the top 10 features of embedded business intelligence. |
Information about InetSoft's Monitoring Dashboard Software - If you're looking for an easy-to-learn tool for monitoring dashboards, evaluate InetSoft's free and commercial applications. With InetSoft, you can create brilliant charts, graphs and other visualizations with just a few clicks of your mouse. Drill down to see exactly the information you need, or build performance dashboards for sharing with anyone. Visit the Style Scope product page to learn more, see examples, view a demo, and read customer reviews. These pages below pertain to InetSoft's executive monitoring dashboard software...
List of the Basic eCommerce Analytics - In other articles, we will explore advanced analytical techniques for eCommerce. For now the absolute basics that you need to focus on are: How Many People Are Coming Your Way? - Sure we are interested in conversions, but the starting point of the business of eCommerce is to get people to visit your website. So, you need to track your page views, unique visitors, bounce rate, page views per visit, time spent on the website, and the like. By closely monitoring these traffic numbers, you can find out how: word of mouth is spreading different marketing initiatives are yielding traffic you compare with other eCommerce websites...
Metrics vs. Key Metrics Meaning - The most important metrics that a business tracks are called key metrics. Also known as a key performance indicator, or KPI, a key metric is a statistic which, by its value gives a measure of an organization or department's overall health and performance. KPIs, or key performance indicators, are vital metrics connected to time sensitive goals. All organizations, from nonprofits to multinational corporations, need to track key metrics in order...
Problem of Reporting Vanity Metrics - Most businesses are guilty of it. They all have metrics that they track and obsess over. The truth is, vanity metrics are not the way to go. Here's why They Are Easy To Get but Hard To Keep. You can post a new picture on your Instagram and get a few thousand likes in an hour, but what do you do with that data? Is it even meaningful? Maybe in the grand scheme of things, but if you're just looking at a bunch of followers who aren't engaged in your content, it probably isn't worth it...
 |
Learn how InetSoft's data intelligence technology is central to delivering efficient business intelligence. |
Using Dashboards for Marketing Leads - Data analysis and dashboards are critical tools for marketers to make informed decisions, optimize their strategies, and measure their performance. They can help marketers identify trends and patterns in customer behavior, market trends, and campaign performance. By analyzing data, marketers can make informed decisions about what products or services to offer, what messaging resonates with their target audience, and how to optimize their marketing campaigns...
What Are the KPIs That a Public Relations Specialist Tracks? - Public relations (PR) specialists track various Key Performance Indicators (KPIs) to measure the success of their PR campaigns and strategies. Here are some common KPIs that a PR specialist may track: Media Coverage: PR specialists track the quantity and quality of media coverage that their organization or client receives. This can include mentions in news articles, interviews, or other media features...
What to Measure with Online Marketing Reporting? - Measure Your ROI You should also keep tabs on your online marketing efforts by measuring your return on investment (ROI). This will help you determine whether your efforts are paying off and whether you need to make changes to your strategy...


