InetSoft on DM Radio: Changing the Game with New Data Visualization Capabilities
This is the continuation of the transcript of DM Radio’s program titled “The Consumerization of Business Intelligence: How and Why.”
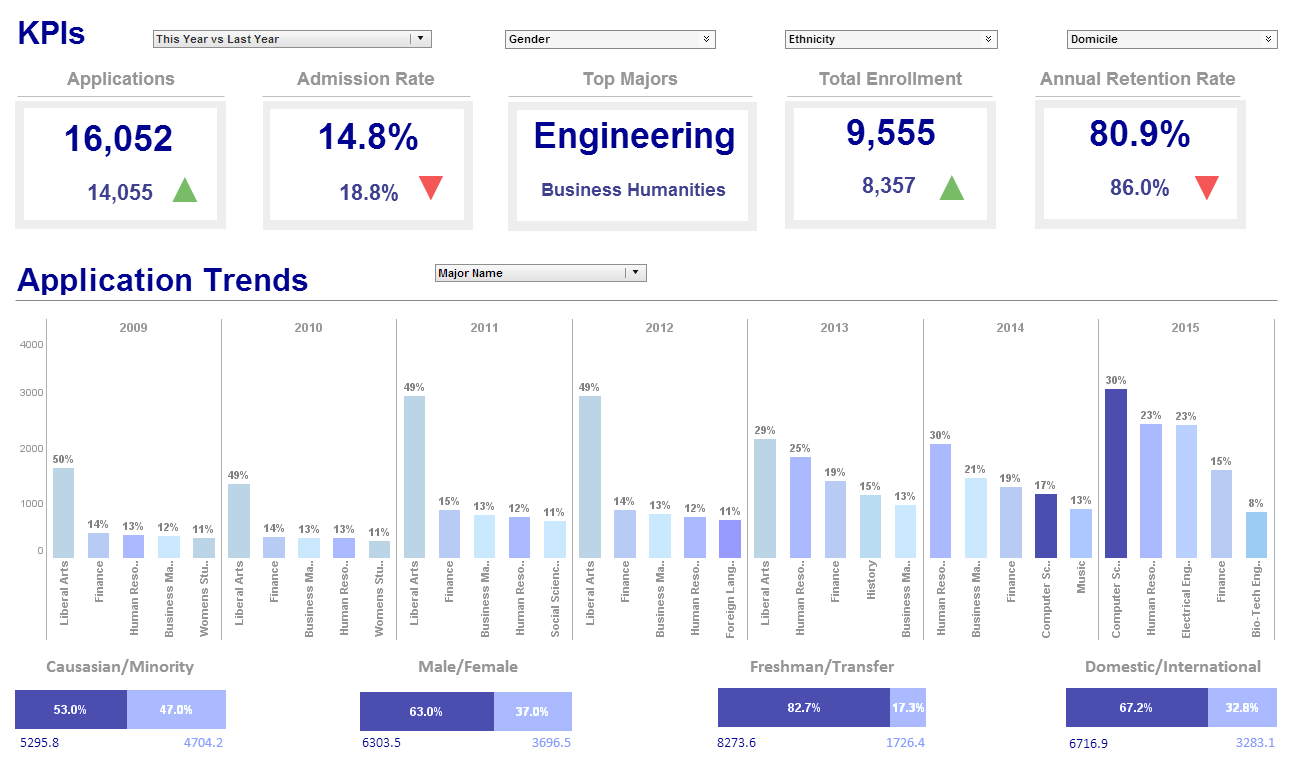
Tracie Kambies: Francois, one of the questions I have for you is, what are you seeing as far as the visualization capabilities? With all of this consumerization of BI, it’s the experience that the user has from having the data at their fingertips. It’s about how the data becomes real to them and how it informs them better. What you are seeing is real demand in this space, because data might be served faster, but it still may just be a bunch of rows and columns. So how is that visualization really helping the adoption and changing the game?
Francois Ajenstat: Well, it's interesting, because visualization isn’t just about a chart; everybody can create charts. Visualization is an approach that helps people to more easily see and understand their data. When you think about how people reason and how their brains work, the cognitive system, the visual system is actually one of the most powerful systems that we have. And when people can see the data on the screen, they are able to reason with that data more easily, “Oh, that bar is bigger than this other bar. This line is going up, or it's going down.”
Visualization Technology
And so, the visualization technology is really an approach, and when people can see the data first, they are able to start leaning in and answering different views, and seeing that data happen immediately. And I think that’s actually a big change in how people’s expectations are shifting as well, where we used to just get green bar reports, they got graduated to more traditional reports of rows and columns. Now as you work with data, it's a picture going after another picture, and without using the cliché that the picture is worth a thousand words, but that’s really why visualization is changing the interaction paradigm of Business Intelligence from my standpoint.
Tracie Kambies: Yeah. I really think the right word is, interaction point, right, because with some of the tools that are coming out today I think to help consumerize BI a little bit faster, it’s that ability to interact real-time with the visual data. The data has been visualized. And while I agree that visualization is that approach, there is also the kind of experience that the user really wants. We were talking about the devices, and the recent front cover of a Time Magazine had a four-year-old with an iPad, and I just think about that four-year-old in 20 years, when they are in the workforce, and wonder what they are going to be doing. They are already in this visual experiential place, so what are they going to be needing and wanting and desiring? We have got to keep pace with that type of growth.
Consumerization of Business Intelligence
Justin Kern: Right. They have already got millennials taking up 40% of the workforce by the end of next year. So that kid’s generation even beyond takes this consumerization of business intelligence and takes this visual element to the Nth degree.
The consumerization of business intelligence (BI) involves designing BI tools to be as intuitive and user-friendly as consumer technologies, empowering non-technical users to access and analyze data independently. This trend mirrors the simplicity of apps like Google or Instagram, prioritizing ease of use, accessibility, and integration into daily workflows. It addresses traditional BI challenges like complexity and IT dependency, fostering a data-driven culture across enterprises.
-
User-Friendly Interfaces
BI platforms now feature intuitive dashboards, drag-and-drop interfaces, and natural language processing (NLP), similar to consumer apps. Tools like Tableau and Power BI allow users to create visualizations or query data using plain language, reducing the learning curve. This enables employees, from marketers to executives, to engage with data without technical expertise.
-
Self-Service Analytics
Self-service BI empowers users to generate automatic reports and insights without IT intervention, mimicking the autonomy of consumer tools. Platforms like InetSoft’s Style Intelligence offer customizable dashboards that non-technical users can tailor to their needs. This reduces reliance on data analysts and speeds up decision-making.
-
Mobile and Cloud Accessibility
Consumerized BI tools are accessible on mobile devices and cloud platforms, similar to consumer apps like Gmail or Dropbox. Users can access real-time insights anytime, anywhere, using tools like Qlik Sense or Zoho Analytics. This flexibility supports remote work and on-the-go decision-making.
-
Embedded Analytics
BI is increasingly embedded into everyday business applications, such as CRMs or project management tools, much like how consumer apps integrate features seamlessly. For example, Salesforce and HubSpot now include BI capabilities within their platforms, delivering insights directly in users’ workflows. This mirrors the integrated experience of consumer tech ecosystems.
-
AI-Driven Simplification
AI and machine learning automate complex tasks like data preparation and insight generation, making BI as simple as using a voice assistant like Siri. Platforms like ThoughtSpot use AI to provide predictive analytics and answer queries in natural language. This reduces technical barriers and enhances user engagement.
-
Focus on Data Storytelling
Consumerized BI emphasizes compelling visualizations and narratives, akin to social media’s engaging content. Tools like Tableau’s Explain the Viz or Power BI’s storytelling features turn data into actionable insights through interactive charts and reports. This makes data more relatable and impactful for non-experts.
-
Cost and Scalability
Like consumer apps with freemium models, modern BI tools offer affordable, scalable solutions via cloud subscriptions. Platforms like Domo or Sisense provide tiered pricing, making BI accessible to small and large businesses alike. This democratizes access to advanced analytics.
Impact of Consumerization
The consumerization of BI has transformed enterprises by broadening data access, reducing IT bottlenecks, and fostering a culture of data-driven decision-making. It empowers employees at all levels to leverage insights, improving agility and competitiveness. However, challenges like data governance and user training remain critical to ensure effective adoption.
Platforms like InetSoft, Tableau, and Power BI lead this trend by offering user-centric tools that align with consumer technology expectations. By prioritizing simplicity and integration, consumerized BI enables organizations to maximize data value while minimizing complexity.


