Create a KPI Dashboard
The key to creating an effective KPI dashboard is selecting the right tool, and InetSoft offers a simple and powerful way for users to create a KPI dashboard in order to meet the needs of any business. Key Performance Indicators, or KPI's, are measurable values that indicate how effectively business goals are being met. It is crucial for businesses to keep track of their most important KPI's to ensure ongoing quality performance and overall efficiency.
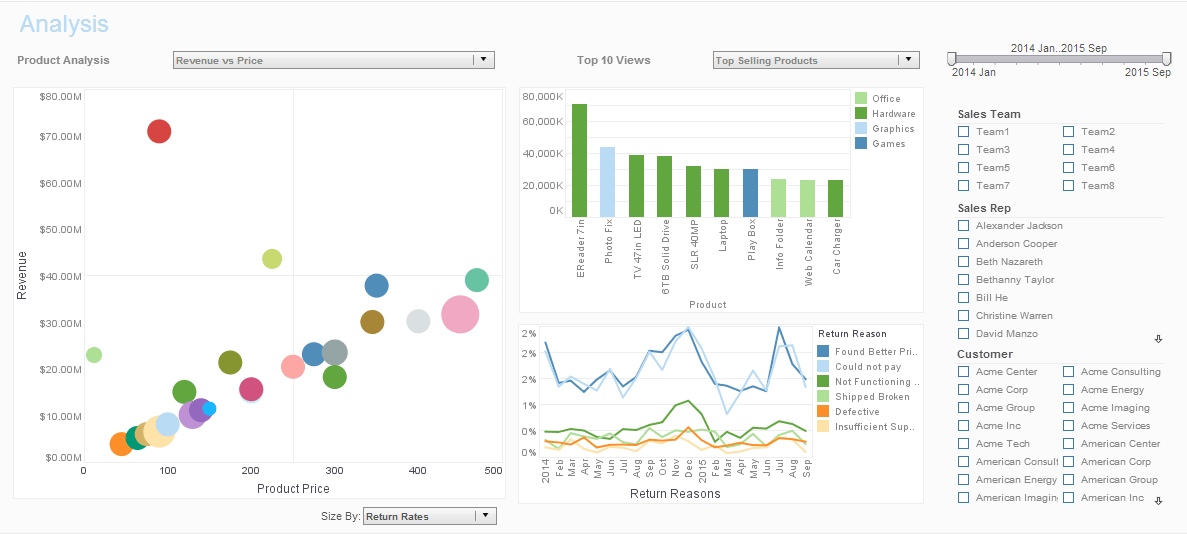
The most effective way to track KPI's is with dashboarding software, and InetSoft's dashboarding software provides leverage to the user by providing a dynamic, visual display of the company's most important metrics. Visual displays offer more insight and predictive analysis capabilities to the user than traditional static reports, which allows businesses to constantly be on top of their goals.
Selecting the Right KPI's
Every department within a business will use different KPI's to measure success, and selecting the right KPI's depends on both the industry as well as what part of the business is being tracked. Some commonly used KPI's that can be seen in many KPI dashboard examples are:
-
Sales
- Sales Growth
- Sales Opportunities
- Product Performance
- Sales per Rep
-
Marketing
- Email Engagement
- Keyword Ranking
- Online Conversions
-
Financial
- Return on Equity
- Vendor Expenses
- Inventory Turnover
- Gross Profit Margin
By tracking these metrics, performance can be compared to the last reporting period to make sure that the company is constantly moving towards achieving goals in all departments.

KPI Dashboard Applications
Once a business has selected their most critical KPI's to track, InetSoft's dashboarding software allows users to display this information in multiple visualizations such as charts, tables, and crosstabs which are fully customizable and easy to manipulate, even for non-technical users.
With InetSoft's KPI dashboards, bare data turns into actionable information that provides insight as to where the business stands and where improvement is needed. For example, if it seems that there is a disparity from where the company should be in an area, InetSoft's dashboarding software allows for interactive drill-down on data so that users can pinpoint exactly where the issues are coming from so that they can be fixed.
A KPI dashboard could be the difference between success and failure in business as these visualizations allow users to spot patterns, trends, and potential problems that a spreadsheet simply could not capture.
When selecting an application to create a KPI dashboard, consider InetSoft's award-winning technology to meet all of your company needs. Interested in finding out more? Request a personalized demo today!