Credit Card Analytics
Understanding who is applying for credit cards and what factors are affecting credit card approvals become increasingly crucial for many financial players in the industry.
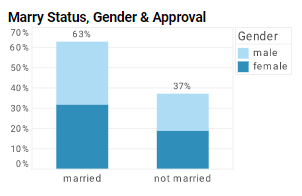
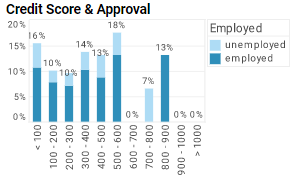
To this end, InetSoft has created a dashboard that investigates several factors associated with credit card approvals, including income, debt, age, ethnicity, credit score, marriage status, and gender. It not only allows financial users to visualize the relationship between a single factor and credit card approval rates at a glance, it also helps users slice and dice relationships easily between different variables with built-in checklists and sliders.


Credit Card Dashboard
With built-in filtering components, financial professionals can easily slice and dice data with simple point-and-click methods to get various insights. They can investigate the relationship between approval rates and all other factors separately for males and females by filtering on gender. They can see how different demographic profiles affect credit card approvals by filtering on a combination of factors including age, ethnicity, income, employment, and marriage status. They can identify segments that are most preferable to credit card issuers by filtering on approved status.
Through the intuitive charts and filter functions on this credit card approval analytics dashboard, financial professionals can be more accurate in constructing credit card customer personas, understanding how different factors interact and affect the credit card approval rate.
Diverse Applications of InetSoft's Credit Card Approval Visualization
InetSoft's visualization dashboard web app is specifically designed to maximize business user self-service. With InetSoft's easy-to-use drag and drop design tools and a variety of charts and visualization types to choose from, financial industry players can easily cater the completed dashboard to specific needs and personalize the analytical views for accomplishing unique goals, such as:
- Potential cardholders can use the dashboard to assess the success rate of a possible credit card application.
- Financial analysts can investigate how different factors interact and affect approval rate, and generate insightful reports for publication.
- Commercial banks can use the dashboard to monitor credit card applications and gather instant insights on approved accounts, for risk assessment and management.
- Financial entrepreneurs can use the dashboard to identify credit card customer segments and discover new business opportunities.
- Application Risk Scoring: Uses predictive models to evaluate the likelihood that a new applicant will repay their debt. These models incorporate credit bureau scores, internal data, income, and employment information to calculate risk-adjusted approval decisions.
- Fraud Detection Analytics: Analyzes patterns in application and transaction data to detect synthetic identities, fraudulent behavior, or inconsistencies that may indicate application fraud. Machine learning and rule-based models are often used in combination.
- Credit Line Optimization: Determines optimal credit limits based on predicted customer behavior and risk tolerance. Balances potential revenue (via interest and fees) against the risk of default and exposure.
- Account Performance Monitoring: Tracks account behavior over time using metrics like payment timeliness, balance utilization, and spending patterns. Helps identify early warning signs of default or delinquency.
- Collections Strategy Analytics: Segments delinquent accounts to determine the best contact method, message tone, and timing. Predictive models help prioritize which accounts are most likely to respond to collection efforts.
- Loss Forecasting and Provisioning: Uses historical and real-time data to forecast future credit losses and determine required capital reserves. Essential for regulatory compliance and financial planning.
- Operational Efficiency Metrics: Analyzes staffing levels, turnaround time, workload distribution, and process bottlenecks. Helps streamline application processing and credit decisioning workflows.
- Compliance and Fair Lending Analytics: Ensures credit decisions are free from bias and comply with laws such as the Equal Credit Opportunity Act (ECOA). Audits models and outcomes for fairness, accuracy, and consistency.
- Customer Segmentation: Groups applicants and existing customers by behavioral and financial characteristics. Supports targeted credit strategies, such as pre-approvals, limit increases, or retention offers.
- Portfolio Risk Monitoring: Aggregates risk metrics across the full credit portfolio to identify concentration risks, exposure levels, and performance trends. Supports strategic adjustments to lending criteria and risk appetite.
- Create A Finance Chart: This article walks you through designing a rich financial dashboard using InetSoft's Visual Composer, including charts showing overdue invoices by count and amount. It demonstrates adding range sliders, gauge charts, state maps, and custom tooltips for interactive filtering. An ideal guide for building finance dashboards that combine visual clarity with analytical depth.
- Unified Views Of: Describes InetSoft’s financial dashboard software that consolidates budget and actuals from disparate ERP systems into a single, interactive view. It highlights easy deployment, drag‑and‑drop filter controls, and an intuitive interface usable by business users. The piece underscores how visual BI simplifies financial performance tracking across departments.
- Transform The Finance Department: A webinar-based exploration of how business intelligence tools can reshape the role of finance from tactical reporting to strategic insight. It covers correlating financial outcomes with operational activities, budgeting, and performance management. Useful for CFOs seeking to evolve finance into a value‑driven business partner.
- Ability To Integrate: Outlines key features of high‑quality financial analysis software, such as intuitive user interface, custom dashboards, integration capabilities, and statistical analysis support. Emphasizes the importance of real‑time reporting and comparative views for informed decision‑making. Relevant for organizations evaluating modern financial analytics tools.
- Track Key Financial: Highlights how a manufacturer used StyleBI to build financial KPI dashboards tracking revenue growth, gross margin, cash flow, and more. Illustrates the adaptability of InetSoft’s platform in complex manufacturing financial environments. Shows how customizable dashboards empower stakeholders with real-time visibility into company performance.
- Self-Service Finance Visual: Promotes the benefits of self‑service financial dashboards that allow controllers to monitor metrics like budget versus actuals, liquidity ratios, and profitability without relying on IT. Explains how InetSoft’s mashup technology unifies finance data and enables executive-level analytics. Discusses agility, user adoption, and the value of interactive visualization in enhancing financial oversight.
- BI Systems Relate To: A deeper look into how BI systems intersect with finance functions, beyond mere reporting. It discusses the shift toward performance management, strategic alignment, and faster response to changing conditions. Offers conceptual framing for finance teams integrating BI into broader business workflows.
- General Ledger Account: Describes a sample finance report built with InetSoft that displays actuals, budget, and variances at company, location, and department levels. It emphasizes drill‑down functionality, label customization, and reuse of report definitions for efficiency. Ideal for finance professionals aiming to produce modular, shareable reports.
- Visual Finance Analysis: Explores how InetSoft delivers visual finance analysis dashboards and machine learning–powered forecasting. It highlights pixel‑perfect reports combined with interactive drill‑down and anomaly detection. Useful for finance teams needing both formatted reporting and advanced analytics in one platform.
- Transaction Reporting Software: Presents InetSoft’s transaction reporting tools capable of producing dashboard-based analytics for any transactional system. Focuses on visual, interactive reporting of transaction data with drag‑and‑drop designer and mashup capabilities. Supports embedding, scheduling, and high adoption among business users.

What Analytics Are Done in Credit Operations?
Credit Operations departments at financial institutions, including credit card companies, rely heavily on analytics to manage risk, improve efficiency, and ensure compliance. These analytics cover the full customer lifecycle—from application through account management and collections. Below are the major categories of analytics performed in credit operations:
These analytics allow credit operations teams to make data-driven decisions that minimize risk, increase profitability, and maintain regulatory compliance. As machine learning and automation continue to evolve, the scope and precision of credit operations analytics are expanding rapidly.
InetSoft's data mashup capability is tightly coupled with visualization as one web app. While building visualization dashboards, the mashup engine enables finance professionals to quickly add data queries such as age and credit score blocks for insightful visual output without writing SQL. With powerful analysis methodologies and an easy-to-use interface, financial professionals can easily create interactive dashboards, perform ad hoc chart editing, and fully control how their visual dashboards will behave on different devices.
With InetSoft's StyleBI, financial professionals can easily create interactive dashboards that are not only visually appealing but also highly functional. The platform's machine learning capabilities allow users to uncover hidden patterns and insights from their data, enabling more informed decision-making.
Furthermore, the platform's cloud-native architecture ensures that financial professionals can access their dashboards from anywhere, anytime, and on any device. This flexibility is crucial. Timely insights can make a significant difference.
In summary, InetSoft's StyleBI provides financial professionals with the tools they need to create powerful, interactive dashboards that enhance their understanding of credit card applications and approvals. By leveraging data mashup, machine learning, and a user-friendly interface, financial professionals can gain deeper insights into their data, leading to better decision-making and improved business outcomes.