Data Visualization Benefits
The benefits of data visualization are many. Businesses can utilize a visualization in many different ways, taking complex data and creating new levels of understanding for their managers. Normally, raw data is a long tedious list of information.
In raw form information can be really hard to decipher, especially within larger data sets. Data aggregated into numbers such as in a report table or calculations done with Excel formulas can also be difficult to draw real insights from.
However, if a visualization is implemented, all of a sudden the data becomes clear to the user. Humans can learn faster from visualizations than from reading and trying to understand large data sets.
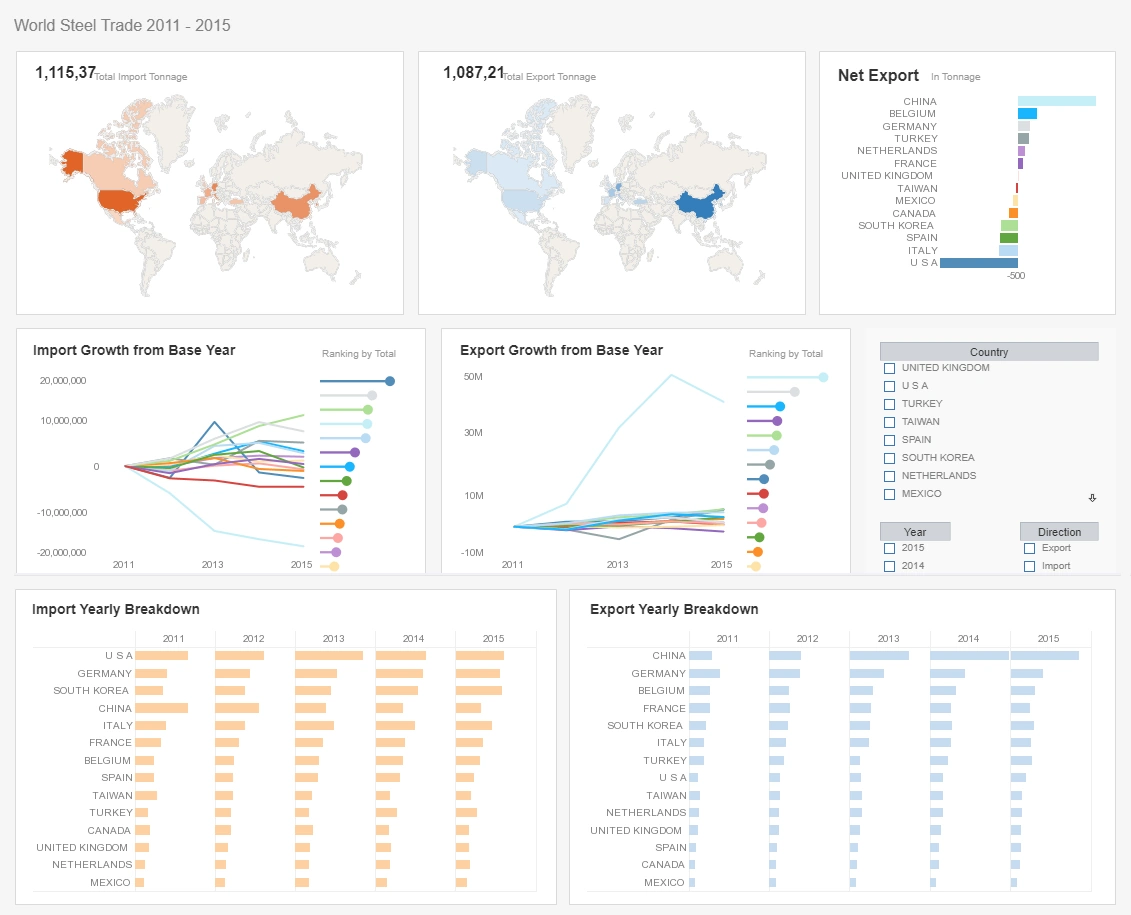
The confusion inherent to report tables, formulas, and calculations created in Excel are also eliminated. If a large data set is visualized through multidimensional charts, it's easy to ask questions such as what category has more inventory or which is doing better financially.

Easy to Segment and Manipulate Data
With InetSoft's software it is very easy to segment and manipulate data, making it easier to show vital data relationships, so that necessary information can be extracted from the larger dataset and shown in a different light. It also allows a project manager to discover actionable information on their own, instead of having to rely on IT requests, causing work slowdowns and straining resources such as time.
Adopting the InetSoft self-service approach to BI creates a broader data culture which enhances efficiency, providing the right environment for exponential gains and long-term growth. By using data visualizations, clients can become more engaged on what exactly is being presented to them.
Clients are more likely to be wowed by crisp and professional visualizations instead of static reports of long tedious lists and numbers. Data visualizations are an impressive way to present strategy and forecasts, and an efficient and clean way to communicate reported insights.
Dashboard Interactivity
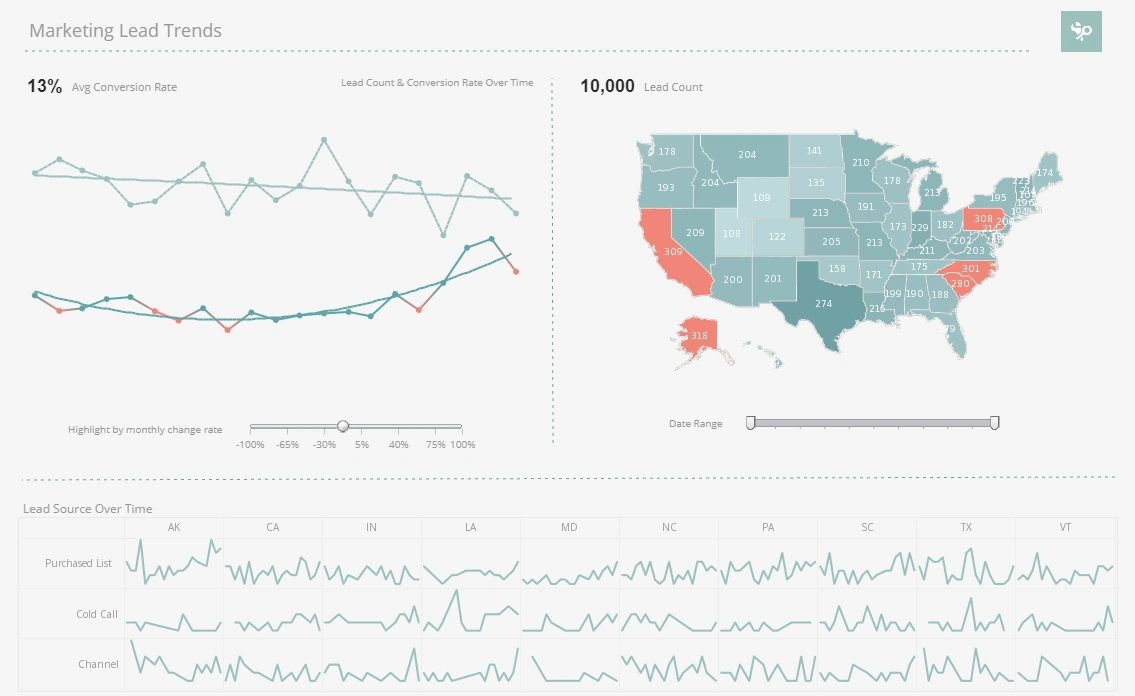
The main benefit of visualizations is discovering correlations. With filters, the user is able to manipulate the data to only show certain ranges of information. For example, if we are talking in terms of sales of toys for a specific business, the user could use a slider to change the visualization to only show data exclusively for toys between $100 and $500.
Changing and manipulating data this way reveals unknown correlations that wouldn't be noticed otherwise. In dynamic dashboards, data can also be interacted with directly. When specific questions are asked, visuals change across the whole dashboard live. This ad hoc interactivity provides presentations that make a splash in meetings where clients will want to ask their own data questions.
Data visualizations also make it easier for the user to discover trends and correlations between data sets. By being able to move data around, and visualizing effects, a project manager can literally see correlations and recognize hidden patterns.


User-friendly and Customizable
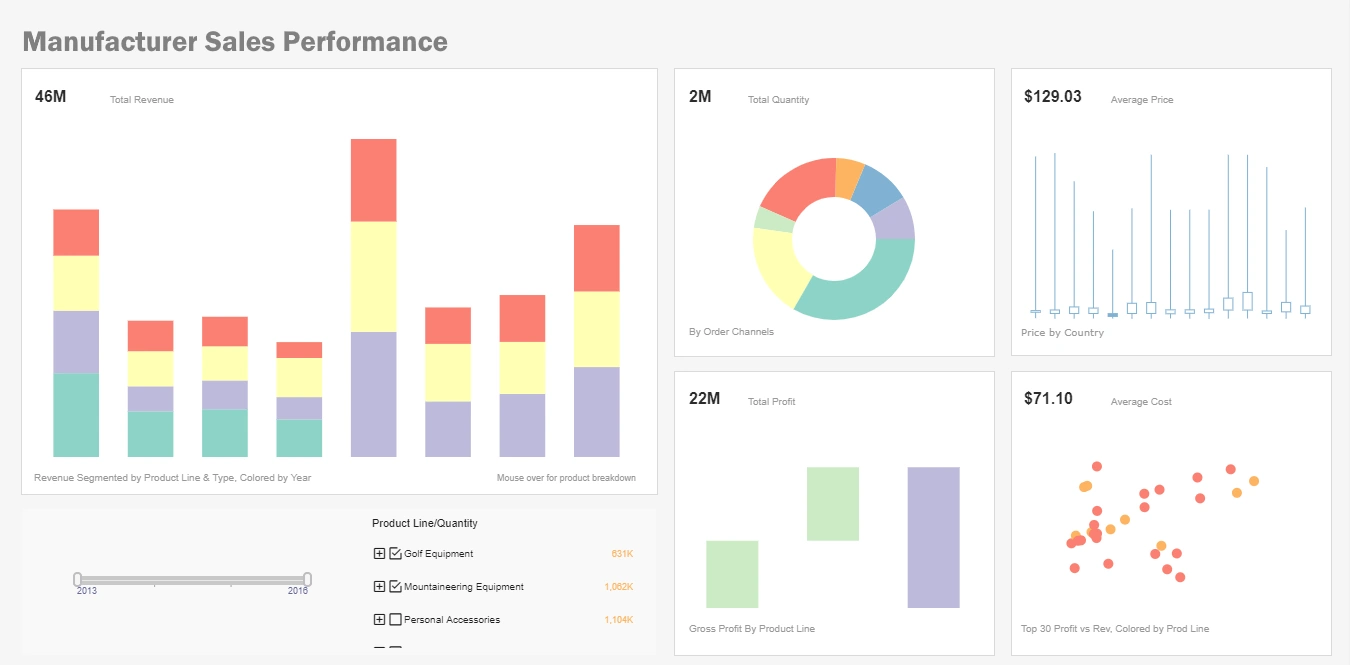
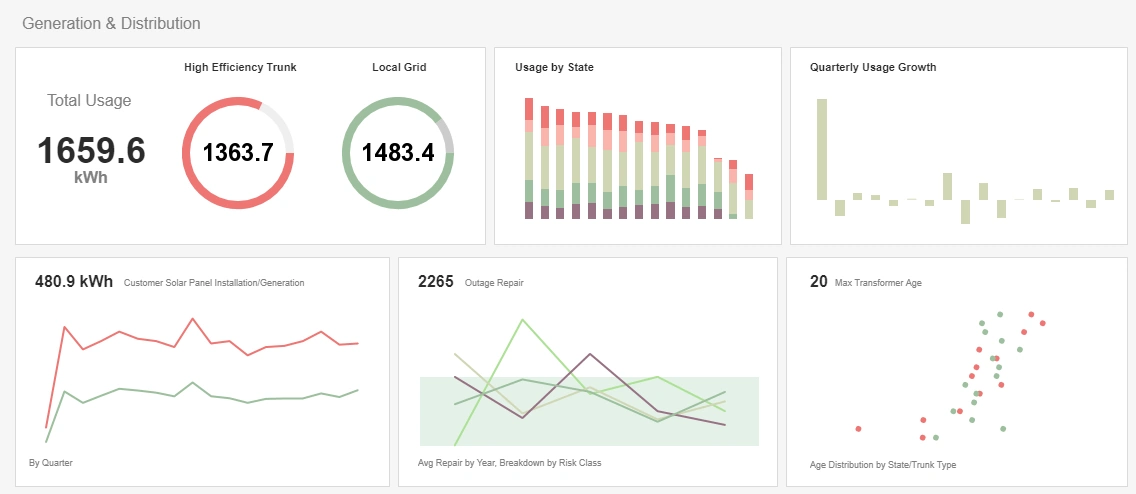
Charts and graphs can help organize information into useful visualizations that can better help the user understand the data. Sliders help isolate a specific range in the data that the user can customize for whatever they are particularly looking for. Gauges are a popular way to display data, often paired with dynamic KPI's. Drop-down menus can be created to isolate particular variables being displayed on the dashboard.
All dashboards created with InetSoft's program are user-friendly and can be customized, so the user can move around whatever they need to. Users also have the ability to bookmark unique views of their dashboard. This means that any views of the dashboard using any of the tools can be saved to be analyzed later, allowing a specific analysis or investigation into the data to be paused and resumed at any time.
The brushing tool is also unique because it can take a particular segment of data and isolate it from the group, making the right information highly visible, even at a glance. By brushing a data element in a chart, the rest of the dashboard reporting environment will highlight with how your brushed data is related.
With this ad hoc style, the end-user can ask a lot of data questions in a short time. And because of the built-in interactivity, your KPI's can change to reflect the specificity of the brushing instead of requiring new levels and layers of scripting and coding.
Overall, InetSoft's program can make a big difference in any type of workplace.