Business Intelligence Visualization
As a provider in the BI visualization industry since 1996, InetSoft delivers solutions to mid-size and large companies. The goal has always been developing powerful BI visualization software that can be used even by a novice.
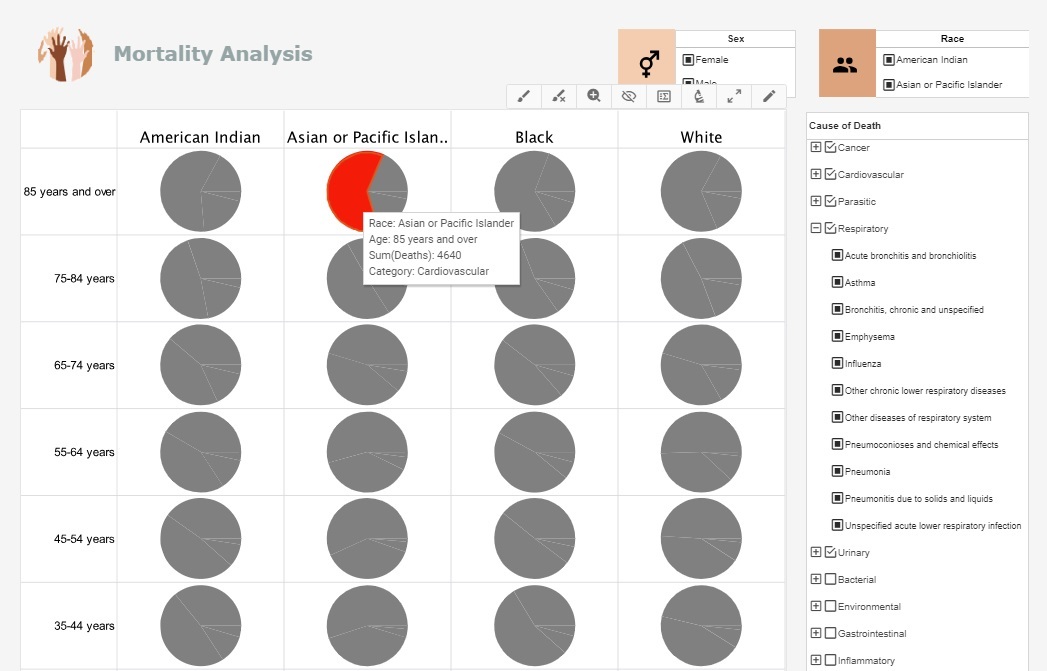
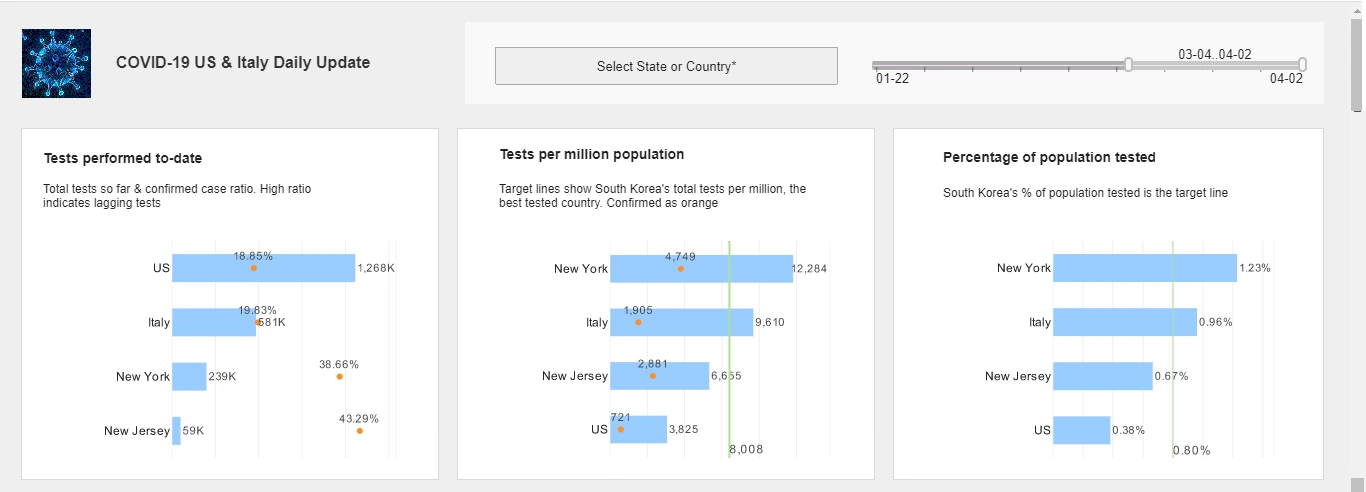
In common language the phrase business intelligence could be described as recording a business's data and asking it questions to develop intelligent strategy. Successful businesses rely on the collection of customer, product and other types of data. InetSoft's solution employs advanced business intelligence visualization techniques, such as heat mapping, waterfall charting and bullet graphing.
The keys to maximum self-service is interactivity and accessibility. Users can do drill downs, brushing and filtering from any device including smartphones. Brush the name of a salesperson in a quarterly sales chart and every other chart and table will highlight their impact across the business. Filters like calendars and sliders can change chart displays onto the data from a week, day or smaller, or widen the timeline to a quarter, fiscal year or greater.


Answer Any Question of Your Data
A successful business is going to be asking its data questions such as:
- Where are our most frequent customers coming from?
- Where is our weakest area?
- How are our sales people performing in certain divisions?
- Is this or that product costing us/making us money?
For example, an executive might want to know: has this salesperson always been a better performer in this product division, or are they just connected to a larger customer? StyleBI can visualize all of the necessary dimensions and measures easily and in different combinations so the user can render the most accurate conclusion.
Answering a question like this using a spreadsheet and non-interactive visualizations wastes time and is ultimately not accurate enough. Even when an expert is carefully creating a formula, one missed cell or decimal will result in a data error. But with a business intelligence visualizer pulling the data itself, the risk of human errors that cause altered or corrupted data is eliminated.
The data mashup engine enables disparate data sources to be combined into new assemblies of data, called Data Blocks. These are simply created by dragging and dropping fields onto the the worksheet layer of the program and assembling a new table of the data that the user needs. Using the Style Intelligence platform the user needs no knowledge of coding, SQL language, or any advanced IT to query a database.
Dashboards, Reports and Advanced Visualizations
StyleBI goes beyond basic visualizations like simple pie charts, line and bar graphs and color coded dimensions. While this fashion of reporting is useful for the basics, larger mid-size to large scale businesses would benefit more from the application's deep library of advanced visualization types such as tree, gannt, and jump line.
The server-based application can be scaled to fit the needs of a business easily allowing growth from a few to many users and the ability to attribute ranges of security permissions to groups or specific individuals.