Online Food Delivery Analytics
In the ever growing competitive industry of online food ordering delivery, continuous improvement to achieve higher customer satisfaction is the main agenda for all organizations involved. Today, when customers look to order food online through phone apps, their decision making is eased by the multitude of food service options available to them, catered to their taste and personality.
Much of this ease can be attributed to the data analytics performed by the online food delivery applications to gather necessary insights that can bridge the gap between their current offerings and customer demands.
Why Data Analytics is Essential for Online Food Delivery Success
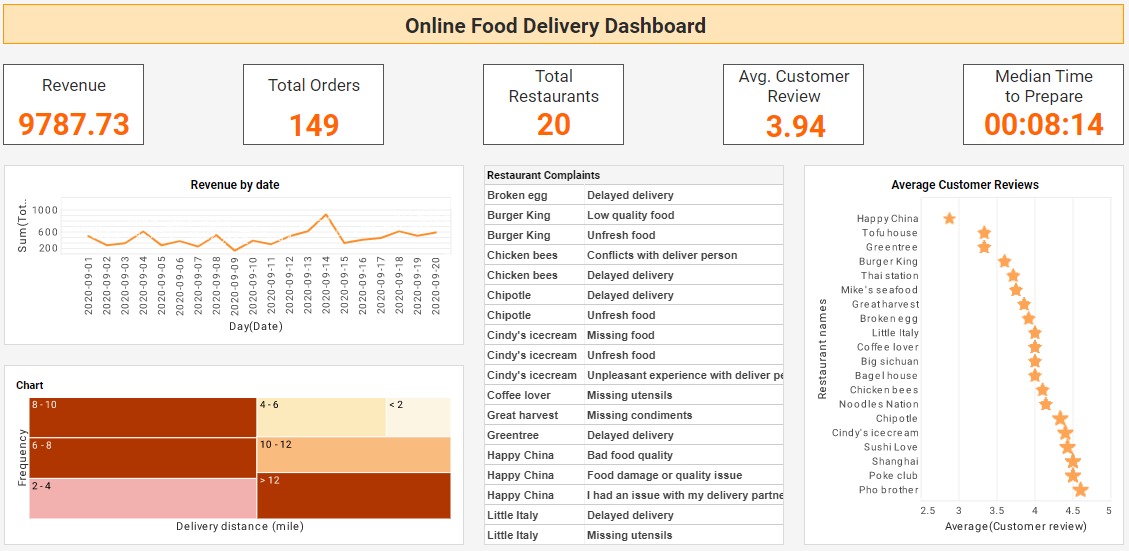
Combining the capabilities of data mashup with powerful visualization, the Online Food Delivery Analytics Dashboard created using InetSoft's Style Scope caters to the requirements of food delivery app analysts who are looking to derive important insights that can help their business offer better service to their customers and generate higher revenue.
The unique device adaptability feature of InetSoft's Style Scope makes it easy to switch between multiple devices without compromising on the interactivity of the dashboard. If desired, you can design one layout for each device category.
Key Features of InetSoft's Online Food Delivery Dashboard
KPIs for Measuring Overall Performance
KPIs are an effective way to present a consolidated view of the performance of an organization in a quantifiable format. Inetsoft's Style Scope assists the designers in making the key food delivery metrics such as revenue and average customer review available to the business users, in large, easy to read text.. The designers have chosen to highlight the metrics on the dashboard in a way that encourages the business users to keep overall performance in mind.
Detailed Analysis via Charts
A deeper dive is required to get a more detailed analysis of the functioning of the business. For this purpose, InetSoft's easy-to-use drag and drop tool lets the designers create charts that can help the business users in understand the areas that need improvement and opportunities for growth.
The customer age distribution chart gives a comprehensive view of online food deliveries with regards to the age demographics of the customers. The demographics information presented by the chart assists the delivery app business in understanding the customer segments they need to target when deciding to run ads and offer discounts.
The delivery time analysis chart provides insights into the average time taken to deliver food orders to customers. The chart also provides a comparison of the average delivery time with the average customer review ratings. This information is crucial for the business users to identify the relationship between delivery time and customer satisfaction.
Opportunities for Drilldown via Filters
Customer feedback is the most valuable asset available to an organization, directing constant improvement. A detailed representation of feedback makes it easier for the business to act on the changes that need to be implemented in the organization as a whole in order to meet the customer demands
The average customer review chart lets the delivery app provider keep a check on the underperforming restaurants, denoted by low average customer ratings. When combined with the restaurant complaints table, business users can pinpoint the exact issue faced by the customers of these underperforming restaurants. Analyzing customer feedback not only benefits the delivery app provider but also helps the partner restaurants improve their service.
The filters provided on the top of the dashboard allow the business users to drill down into specific segments of the data. The filters can be used to view data for a specific time period, city, restaurant, and customer age group. The filters can be used in combination to get a more specific view of the data.
More Articles About Analytics in Various Industries
-
Industry Dashboard Solutions
InetSoft’s industry dashboard overview explains how tailored dashboards accelerate decision-making across verticals by combining operational metrics, alerts, and visual analysis. The article emphasizes patterns for packaging dashboards by role and by industry need, showing how different stakeholders — from executives to line managers — consume the same data for different purposes. It also highlights examples and implementation notes that help teams estimate deployment complexity and expected business impact.
-
Manufacturing Analytics Reporting
This piece describes how manufacturing analytics dashboards monitor assembly lines, production floors, and quality control through real-time indicators and exception alerts. It walks through common manufacturing use cases — cycle time, defect-rate analysis, downtime root cause and materials forecasting — and explains how integrated dashboards reduce reaction time to shop-floor issues. The article also covers best practices for integrating disparate shop floor systems and sharing actionable insights with suppliers and operations teams.
-
Data Intelligence For Insurance
The insurance industry write-up explains how automated reporting and interactive dashboards help insurers manage risk, claims, and underwriting performance with greater speed and accuracy. It discusses using multi-dimensional analysis and parameterized reports to monitor claims pipelines, detect outliers, and support fraud detection workflows. The article also shows how insurers can combine internal policy data with external feeds to improve pricing and loss forecasting.
-
Technology Dashboard And Reporting
This page focuses on analytic challenges unique to technology firms — fast release cycles, complex telemetry and security monitoring — and how dashboards can centralize operational view. It explains embedding dashboards into technology products and admin consoles to provide real-time observability and compliance reporting without requiring specialized BI skills. The write-up also gives examples of network monitoring, incident dashboards, and integrated product usage analytics.
-
Travel Industry Data Analytics
The travel industry guide outlines how descriptive and near-real-time analytics support yield management, demand forecasting, and last-minute pricing strategies. It explains using combined historical, booking, and external signals (weather, events) to optimize offers and reduce unsold inventory. The article also highlights dashboards that help operations coordinate across channels — reservations, partners, and on-the-ground services — to improve guest experiences and margins.
-
How The Railroad Industry Uses
This railroad analytics article illustrates applications for IoT telemetry, preventive maintenance dashboards, and safety monitoring in rail operations. It shows how real-time dashboards aggregate sensor data from rolling stock and wayside equipment to reduce downtime and improve service reliability. The article also describes analytics-driven scheduling and cargo-tracking reports that boost operational efficiency for freight and passenger services.
-
Business Intelligence In Education
The education sector page highlights dashboards designed for administrators, faculty, and student services to track enrollment, retention, and performance metrics. It covers how integrated reporting helps institutions monitor program health, financial metrics, and student outcomes while enabling data-driven interventions. The piece also emphasizes easy deployment and role-based access so diverse stakeholders can securely view the metrics they need.
-
Real Estate Industry Analytics
This article discusses how real estate firms apply predictive analytics and market intelligence to improve pricing, occupancy forecasting, and portfolio performance. It showcases dashboards for property managers and investment teams that blend market feeds, transaction histories, and operational KPIs. The write-up also describes visualization techniques that make complex portfolio comparisons and trend analyses easier to interpret for non-technical stakeholders.
-
Business Intelligence Industry
Trends
An industry trends article that summarizes how BI is evolving with AI, embedded analytics, and data mashup capabilities to serve modern analytic needs. It explains the shift from static reporting to self-service, predictive, and embedded analytics and what that means for product teams and end users. The piece offers practical guidance on prioritizing features such as mashups, multi-source blending, and low-code delivery when evaluating BI platforms.
-
Why Use Data Analytics
This overview explores the role of data analytics across industries and why companies choose a mashup-capable BI platform to consolidate fragmented data sources. It covers typical outcomes — faster insight, cost control, and improved marketing and operational decisions — and gives examples across niche industries to demonstrate breadth of applicability. The article also includes considerations for selecting analytics tools, such as integration flexibility, deployment model, and ease-of-use for business teams.


