PostgreSQL Business Intelligence Dashboard Reporting
PostgreSQL is an object-relational database management system available for many platforms. It implements the majority of the SQL:2008 standard, is ACID-compliant, is fully transactional, has extensible data types, operators, index methods, functions, aggregates, procedural languages, and has a large number of extensions written by third parties.
Data Integration Software
The information access needs of each business vary greatly. From the data sources used, to the dashboard or report design requirements, to the security needed; every company has their own unique set of requirements that must be fulfilled.
One important topic that is often forgotten is that of data source integration. If data cannot be retrieved, it cannot be used to produce reports. StyleBI provides interfaces for multiple data source types and a flexible Java API that can interface with any custom data source.

StyleBI
Just as the dashboard and reporting requirements differ between each business, so do the data integration requirements. Some businesses need to report off of standard relational databases whereas others need to report off of data sources such as XML or Java beans.
StyleBI supplies an out-of-the-box interface for every popular data source type and a flexible API that can be used to integrate with any custom data source.
All data source connections are defined in and managed through the Query Builder in the Report Designer and the Visual Composer. The type of source can be selected from the dropdown list and then the particular connection information can be entered. Each data source type requires specific connection information related to that source.
Other Data Access
StyleBI provides more choices for data integration than many other reporting and business intelligence tools on the market. Interfaces for relational databases, XML, SOAP, CORBA, flat files, and custom data sources provide unlimited flexibility for data source integration and multiple data source access.
A powerful meta-data layer provides report designers and end-users with the ability to create ad hoc queries for any report without having knowledge of the particular data source. StyleBI can integrate with any data source to produce any type of dashboard or report for all end-user populations.
How a Deicing Equipment Manufacturer Uses StyleBI for Dashboard Reporting on PostgreSQL and Enterprise Data
Deicing equipment manufacturers operate in a niche yet essential sector, providing solutions for airports, airlines, and ground service operators to ensure aircraft safety in icy conditions. The industry demands precision engineering, strict regulatory compliance, and timely delivery, all while managing complex supply chains and maintenance schedules. One mid-sized deicing equipment manufacturer sought to improve its operational visibility and decision-making by adopting StyleBI to consolidate dashboard reporting across PostgreSQL and other enterprise data sources. The goal was to transform fragmented operational and financial data into actionable insights that could drive performance improvements across the organization.
Before implementing StyleBI, the company relied on a combination of PostgreSQL databases, Excel spreadsheets, and isolated reporting tools. While the PostgreSQL databases contained detailed production and inventory records, other critical information—such as procurement, sales, and maintenance logs—was scattered across various enterprise systems. Compiling comprehensive reports required manual extraction, transformation, and aggregation, which was time-consuming and prone to errors. The lack of a unified dashboard made it difficult for executives and department managers to monitor overall performance, respond to operational issues in real time, or track financial outcomes effectively.
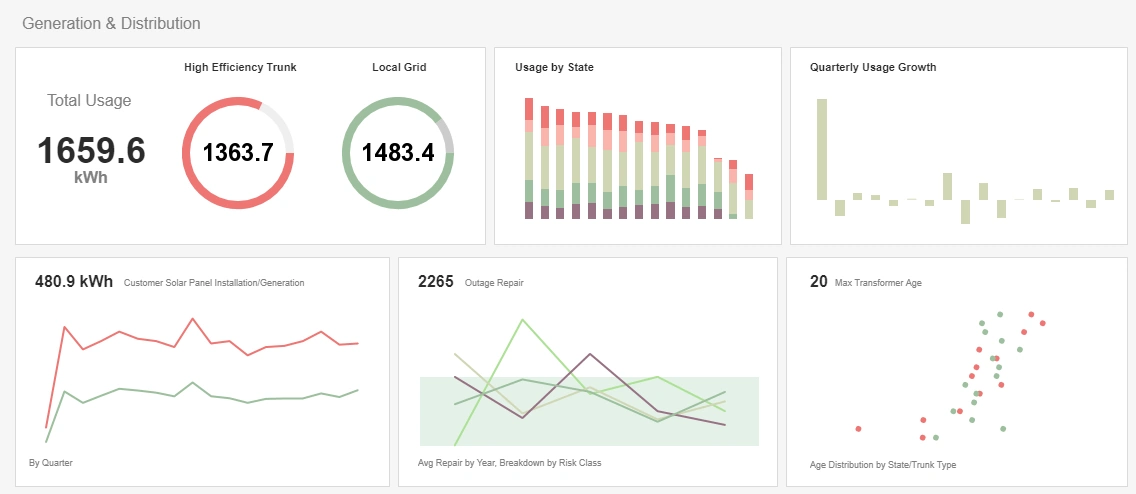
StyleBI provided the solution by enabling seamless integration of PostgreSQL and other enterprise sources into a single reporting platform. The software’s data mashup capabilities allowed the company to consolidate structured and unstructured data from ERP systems, CRM tools, and production databases without extensive coding or IT intervention. As a result, dashboards could now display real-time insights on production output, inventory levels, delivery schedules, and financial performance simultaneously. By creating a unified data view, StyleBI eliminated silos and provided the leadership team with a reliable source of truth for operational decision-making.
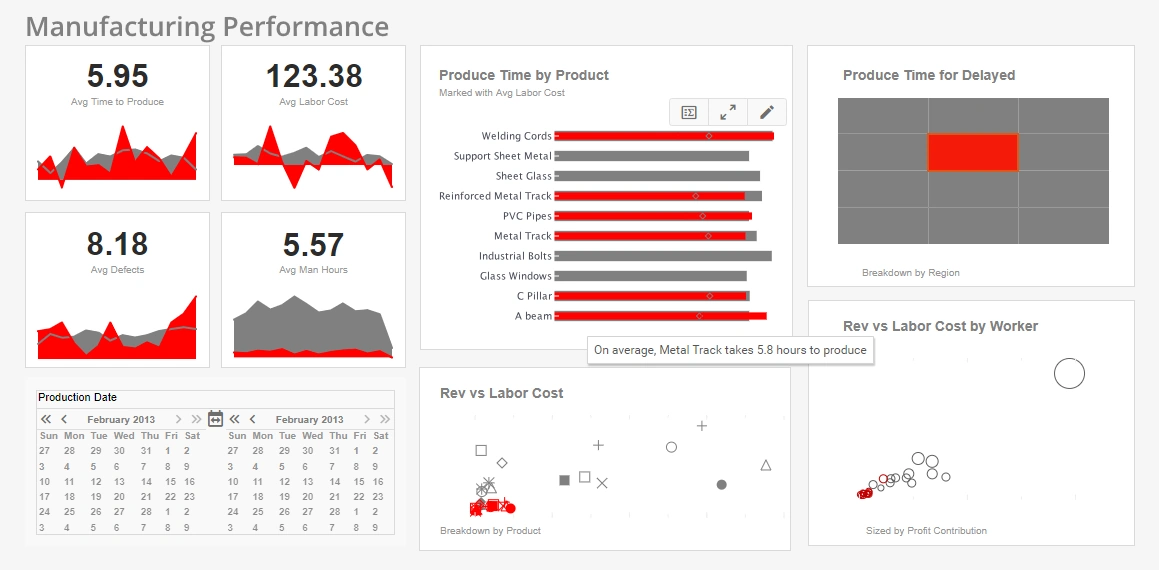
One of the most valuable features for the deicing equipment manufacturer was the ability to customize dashboards for different operational roles. Production managers could monitor machine utilization rates, defect rates, and maintenance schedules directly from a visual dashboard, enabling quick adjustments to prevent downtime. Procurement teams could track supplier performance, material availability, and order timelines, ensuring that critical components were delivered on schedule. Meanwhile, executives could view high-level KPIs such as revenue trends, cost efficiency, and overall production throughput, all derived from consolidated data sources. This role-based customization improved accountability and ensured that every department had relevant insights at their fingertips.
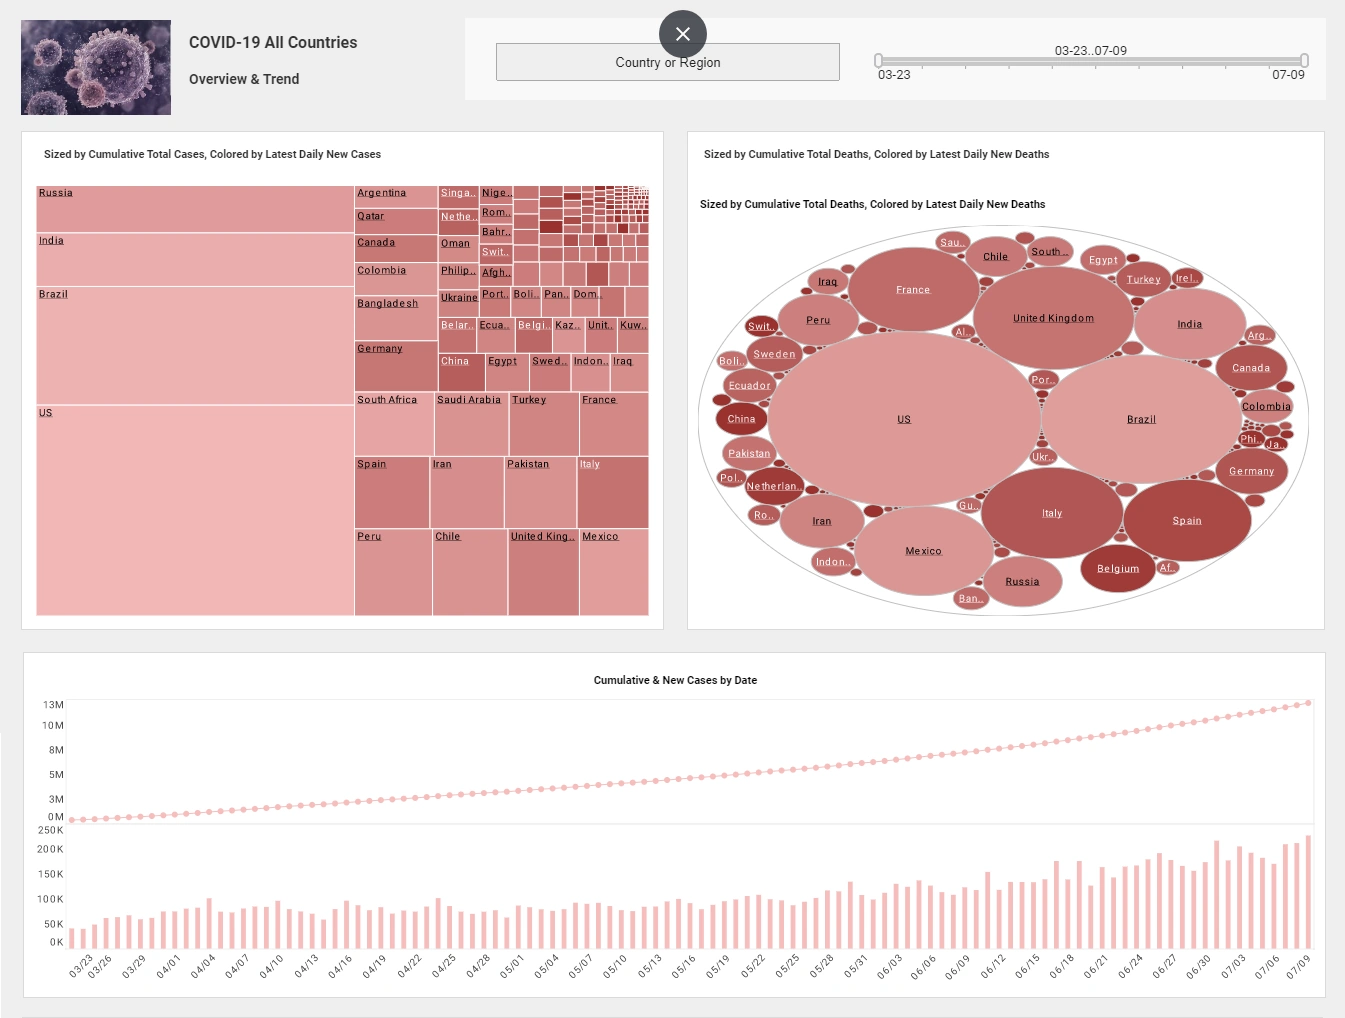
StyleBI also enhanced analytical capabilities by providing multidimensional views and drill-down functions. For example, the company could analyze defects in deicing units by production line, supplier, and material batch, uncovering root causes that were previously hidden in disparate systems. Dashboards could also compare planned versus actual production volumes, monitor seasonal demand patterns, and track the financial impact of operational bottlenecks. The platform’s ability to handle complex queries and large datasets from PostgreSQL made it possible to perform sophisticated analysis without slowing down the reporting process.
Financial reporting benefited as well. Previously, compiling data from multiple enterprise systems for quarterly or monthly reports required significant manual effort, delaying insight into profitability, costs, and resource allocation. With StyleBI, these reports became automated and visually interactive, allowing finance teams to track KPIs such as margins per product line, cost per unit, and return on investment for capital expenditures. These dashboards provided immediate insight into how operational decisions affected financial performance, helping executives make informed choices to optimize efficiency and profitability.
