Looking for Simple to Use Dashboard Software?
Are you nervous that not having IT or programming experience will stop you from building your own dashboards? For those who lack know-how experience, the idea of self-service dashboard building can seem overwhelming. With InetSoft's software, creating dashboards is a quick and simple process, so you can start analyzing business data right away. InetSoft's simple dashboard software is designed with simplicity in mind for both the dashboard designer and the user of the interactive reports.
InetSoft's dashboard software uses a visual approach to building reports and visualizations, allowing complex views to be built with a simple drag and drop user interface. Once IT has completed the initial steps of defining data sources, business users can create their own worksheets, which contain combined fields from multiple data sources. InetSoft's unique data mashup feature makes it possible to combine any type of data into one visualization. Users create data mashups through InetSoft's data block, enabling fields from different data sources to be joined together in a Lego-like block fashion, with a few clicks of a mouse.
| #1 Ranking: Read how InetSoft was rated #1 for user adoption in G2's user survey-based index | Read More |
With InetSoft's Simple Dashboard Software, users can:
- Combine all types of data from any sources
- Provide graphics of key data
- Easily create, access, customize, and share dashboards
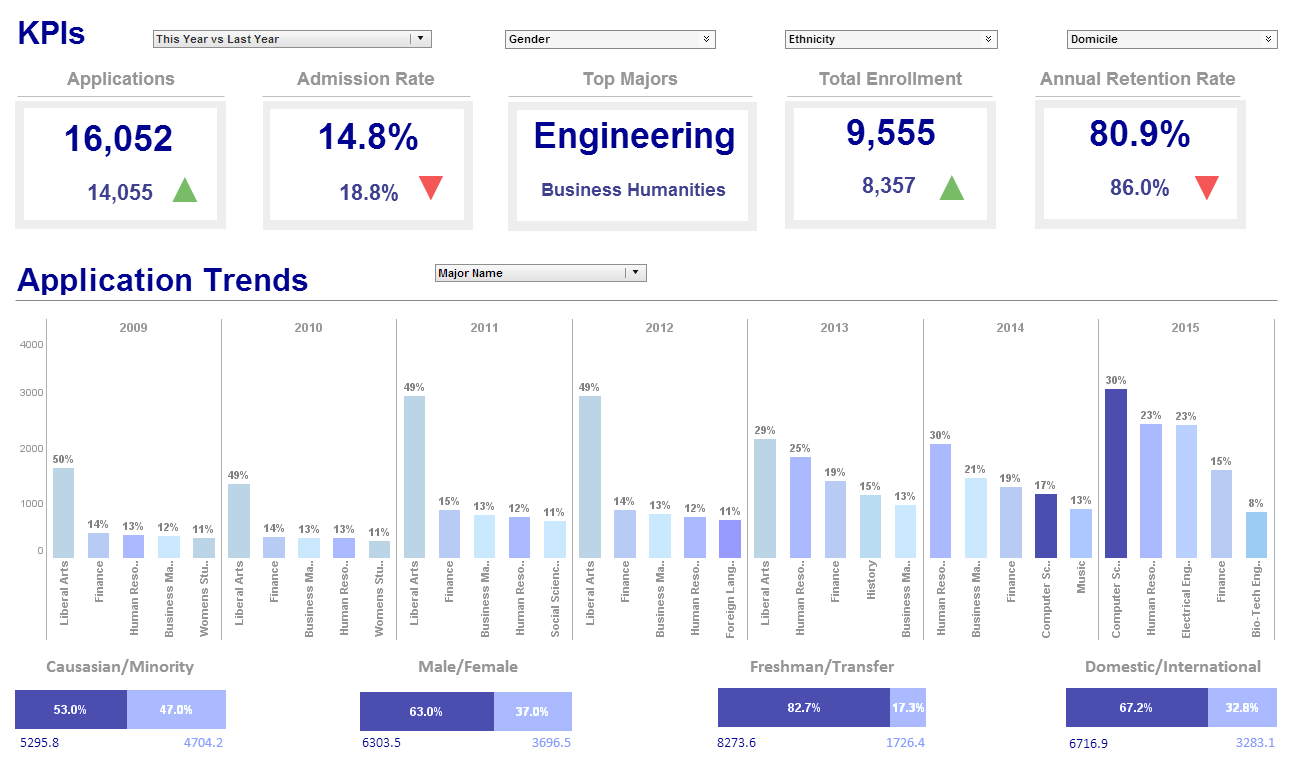
- Track KPIs, discover trends, and make observations and conclusions
- Gain access to data in seconds
- Share data anywhere
- Access visualizations through desktop, tablet, or mobile device
Benefits of Building Dashboards
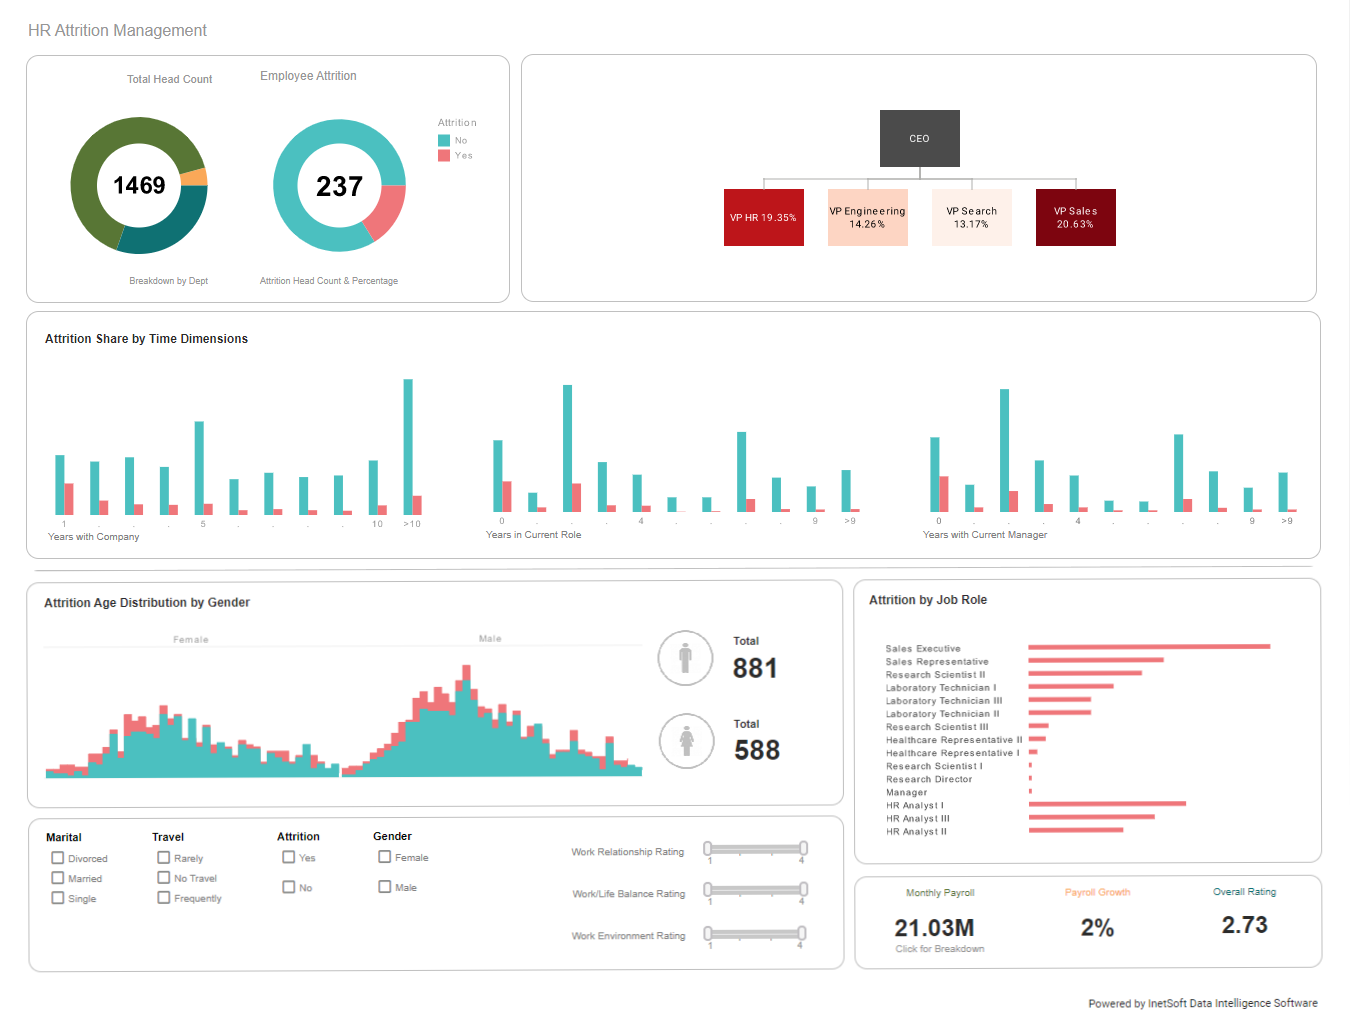
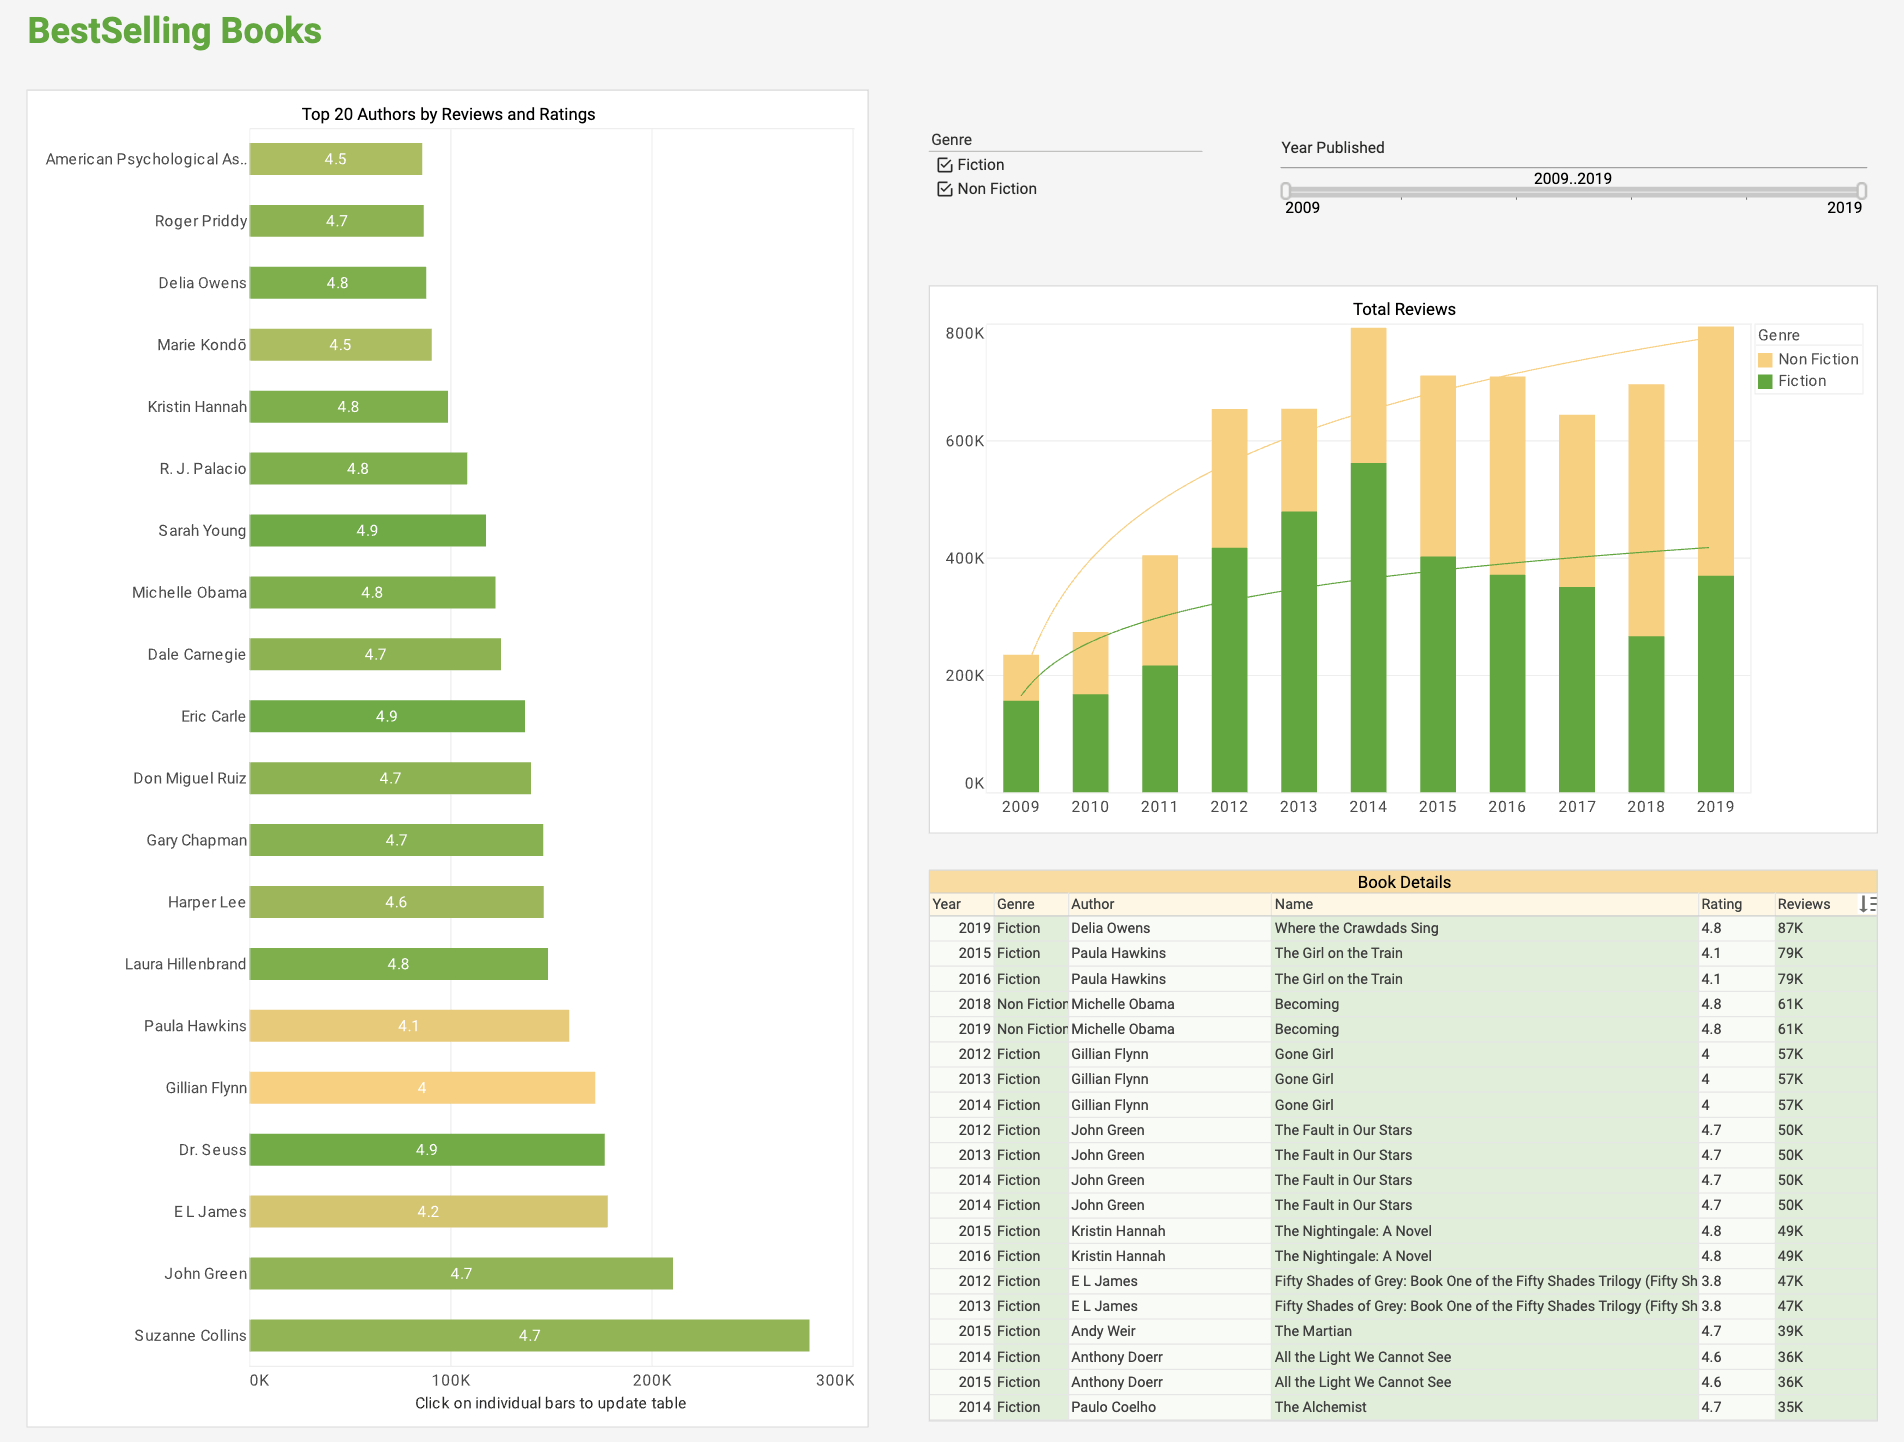
Visualizations are constructed simply, and can include existing data source connections or even embedded csv or excel data uploaded on the fly. This kind of flexibility helps you easily track and see where your company stands. You have the flexibility of choosing what data to include, along with various options for customization. Users can more easily analyze, visualize, and drill down into details, for all types of analysis. Dashboards help show trends, changes in your company, and strengths and weaknesses, providing a clearer understanding of your company. They have 100% access to real-time data, ensuring that your company's information is accurate and up-to-date. InetSoft-created dashboards will provide clear snapshots of your company's performance, for effective business monitoring and better decision making.
 |
Read why choosing InetSoft's cloud-flexible BI provides advantages over other BI options. |
What Makes InetSoft's Dashboard Software Simple to Use?
InetSoft's dashboard software is designed with a focus on simplicity and user-friendly features, making it accessible to a broad range of users, including those without extensive technical expertise. Here are key factors that contribute to the simplicity of use in InetSoft's dashboard software:
- Intuitive Drag-and-Drop Interface:
- The software features an intuitive drag-and-drop interface that allows users to easily add, arrange, and customize dashboard components without the need for coding or complex configurations.
- User-Friendly Design Tools:
- InetSoft provides design tools with a user-friendly layout, making it straightforward for users to create and modify dashboards. Design elements are logically organized, enabling users to navigate and customize with ease.
- Pre-built Templates and Widgets:
- The software offers pre-built templates and widgets that users can leverage as starting points for their dashboards. These templates simplify the process of creating common dashboard layouts and visualizations.
- WYSIWYG (What You See Is What You Get) Editing:
- InetSoft's WYSIWYG editing capabilities allow users to see real-time previews of their dashboard designs as they make changes. This immediate feedback enhances the user experience and streamlines the design process.
- Interactive Data Exploration:
- Users can interactively explore and analyze data within the dashboard, enabling a dynamic and responsive experience. This feature enhances the usability of the dashboard for data-driven decision-making.
- Point-and-Click Data Connections:
- Connecting to data sources is simplified through point-and-click interfaces. Users can easily connect to SQL Server databases and other data repositories without the need for complex setup procedures.
- Responsive Design:
- InetSoft's dashboard software is designed to be responsive, ensuring that dashboards adapt to different screen sizes and devices. This responsiveness enhances usability on desktops, tablets, and smartphones.
- Guided Data Exploration:
- The software provides guided data exploration features, allowing users to navigate and analyze data with step-by-step guidance. This is particularly helpful for users who may be new to dashboard creation.
- Collaboration Features:
- InetSoft supports collaboration features, enabling users to share dashboards, collaborate on projects, and provide feedback. Collaboration tools enhance the user experience by fostering teamwork and knowledge sharing.
- Extensive Documentation and Support:
- InetSoft offers comprehensive documentation and user guides that assist users in understanding the features and functionalities of the software. Additionally, responsive customer support contributes to a positive user experience.
- Embedding Options:
- The software provides options for embedding dashboards into other applications or portals, making it seamless for users to integrate dashboard visualizations into existing workflows.
- Secure Access Controls:
- While focusing on simplicity, InetSoft also ensures that access controls and security features are robust, allowing administrators to define permissions and control access to sensitive data.
More Resources About Simple Dashboards
Dashboard Tools That Are Easy to Use - Dashboard reporting tools offer managers a convenient tool for monitoring their company's performance. They act as a control center for a company, facilitating a 360 degree view of all key business metrics. Unlike a control center, however, dashboards are a much more portable solution. Dashboard tools can be embedded into existing software or exist as...
Embed Links in Dashboards - Are you looking for a dashboard software that has the ability to embed links to URLs and other dashboards? InetSoft's pioneering dashboard reporting application has the capability. Easily create great-looking web-based dashboards with an easy-to-use drag-and-drop designer. Links can be dynamically generated based on data in a chart or table or statically specified anywhere in...
InetSoft's Monitoring Dashboard Software Articles - If you're looking for an easy-to-learn tool for monitoring dashboards, evaluate InetSoft's free and commercial applications. With InetSoft, you can create brilliant charts, graphs and other visualizations with just a few clicks of your mouse. Drill down to see exactly the information you need, or build performance dashboards for sharing with anyone...
Simple Business Management Dashboards - Below are some good examples of simple management dashboards. A simple management dashboard can be looked at as an executive tool whose sole purpose it to make information easier to read. These dashboards can include a variety of different types of data, which can all be integrated into an easy to read dashboard. Simple management dashboards allow users...
What Makes Dashboards Useful for Analysis? - Dashboards are valuable tools for analysis, enabling users to gain insights, identify trends, and make data-driven decisions. Some common uses are the following: Data Aggregation: Dashboards aggregate data from various sources and present it in a centralized location. This allows users to have a holistic view of the data, making it easier to identify patterns and trends across different data sets...


