Web Based Query Builder
Business analytics can easily become time consuming and inconvenient for companies, especially when developers have to constantly code and program data into visualizations. Programmers often must code queries manually so that specific data can be retrieved from a database to be interpreted into visual analytics, such as graphs and charts in dashboards and reports.
What developers and end-users alike need is a business intelligence platform with a web based query builder that can perform any data retrieval easily without any hassle.
When it comes to data analytics, InetSoft's StyleBI is the optimal business intelligence software for both programmers and end-users. With its intuitive and robust interface, StyleBI's web based query builder allows users to create queries conveniently and efficiently despite the lack of any prior coding experience or knowledge.


StyleBI’s Query Builder
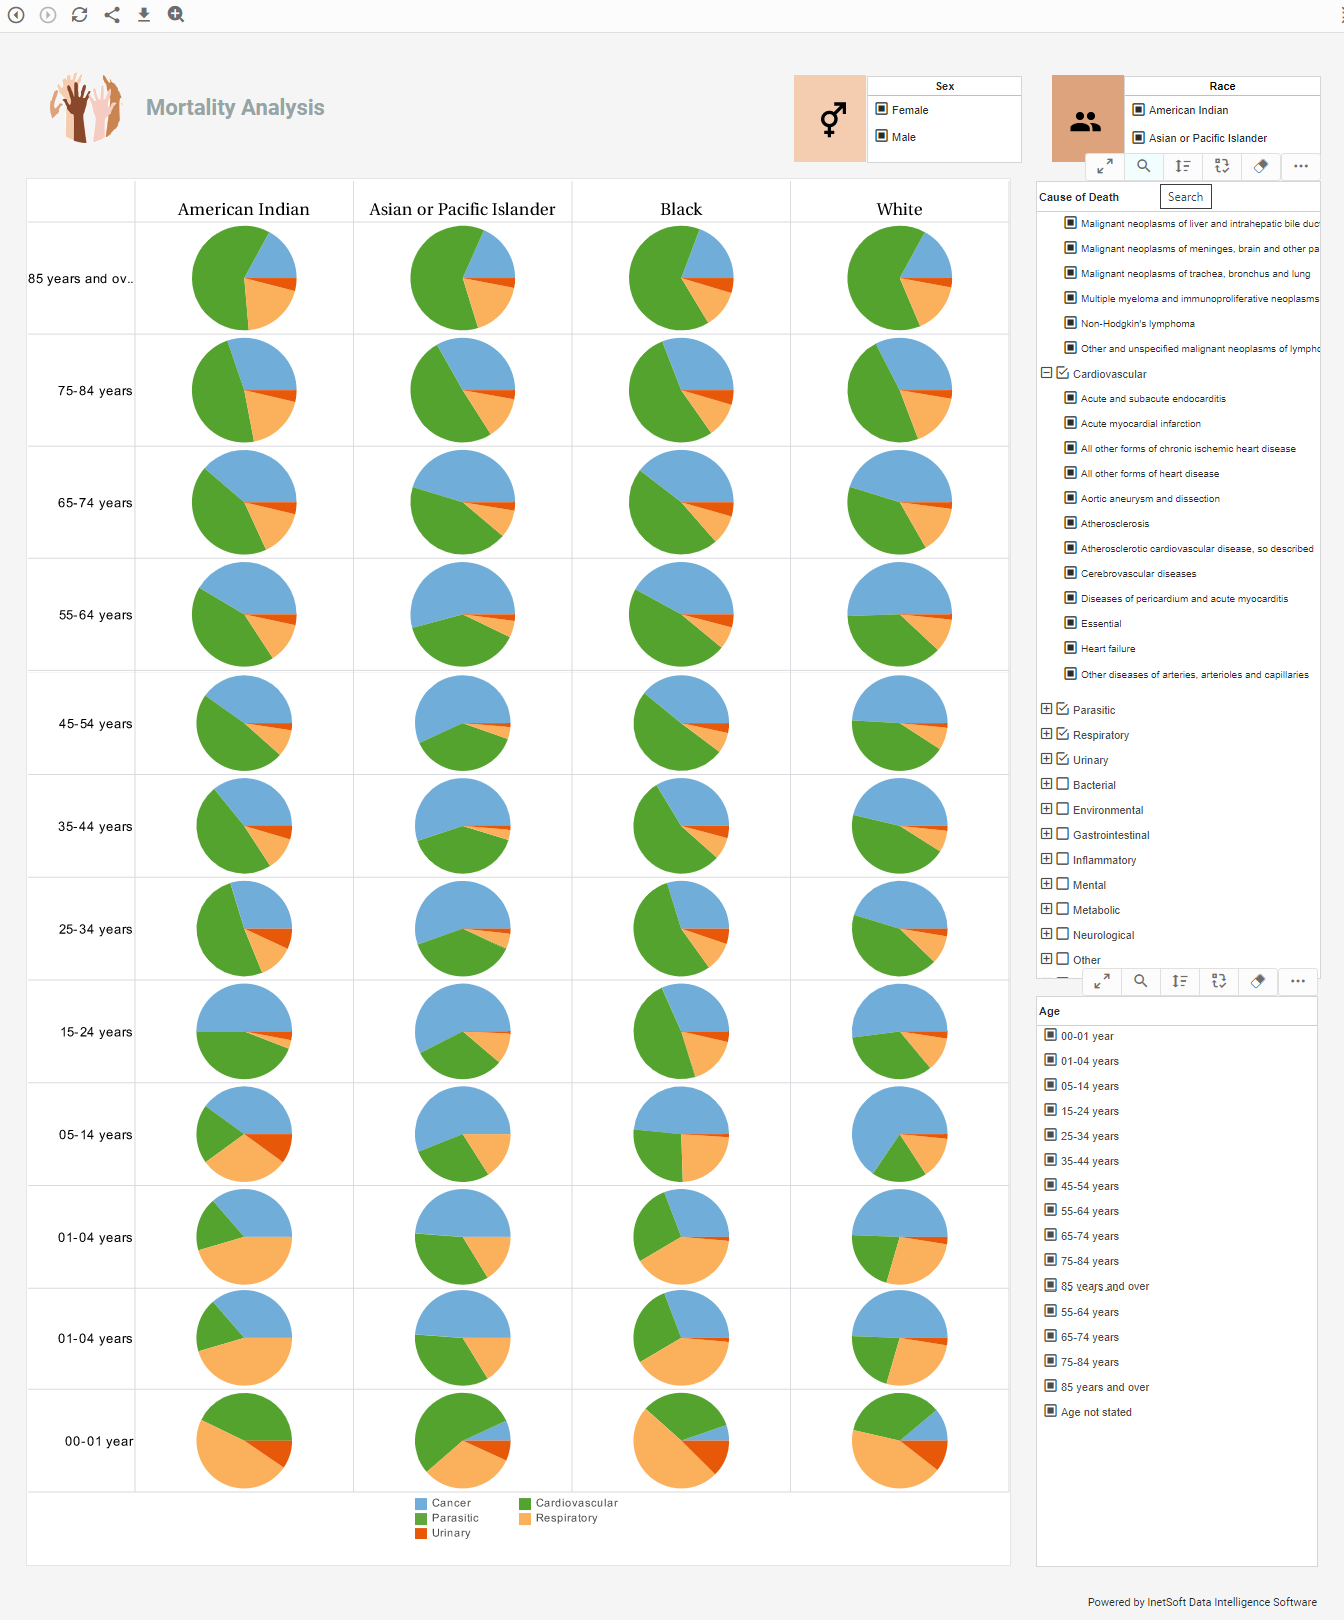
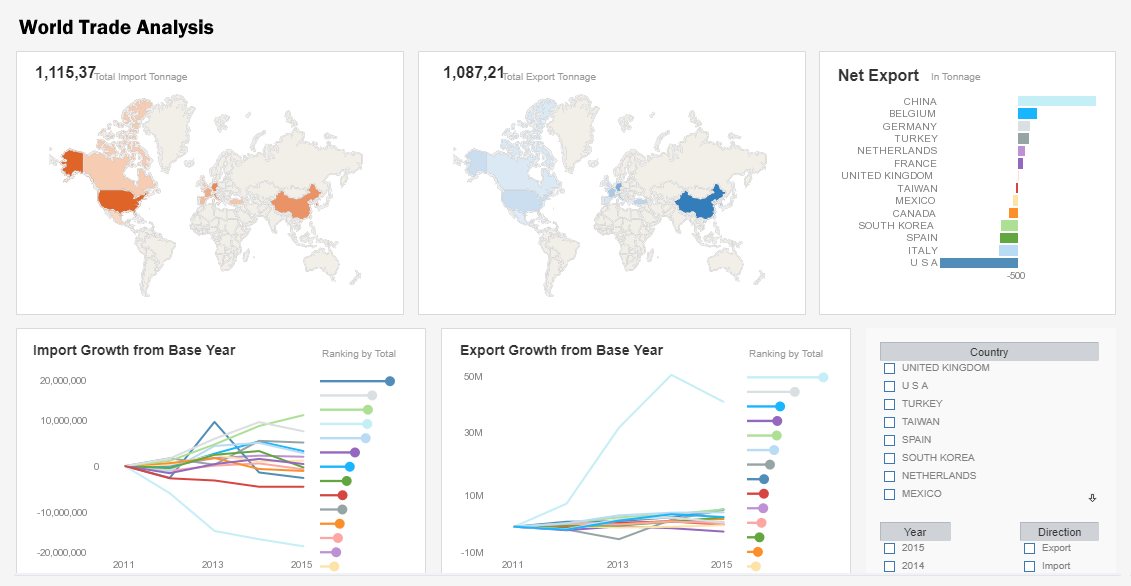
StyleBI's interface is unique, in that it can automatically generate queries based on the initial database query that is set when StyleBI is first connected to a data source. For example, as end-users use drilldown or filtering in their dashboards to view specified information, StyleBI executes the dictated queries that will bring up said data and users will see the visual representation of it. Since InetSoft's software is able to process and generate queries without any necessary coding, end-users are able to access any data within any dashboard or report, instantly making for efficient and fast visualizations of data.
Since StyleBI is web-based, any dashboards or reports can be accessed on any mobile device equipped with a web browser. InetSoft's web based query builder also allows users to use the intuitive drag and drop feature to generate various dashboards or reports with any interactive graphs or charts on any Internet-enabled device without any programming or IT assistance. StyleBI makes an optimal and an effective solution to businesses' dashboarding or reporting needs, for programmers, end-users, and everyone in between.
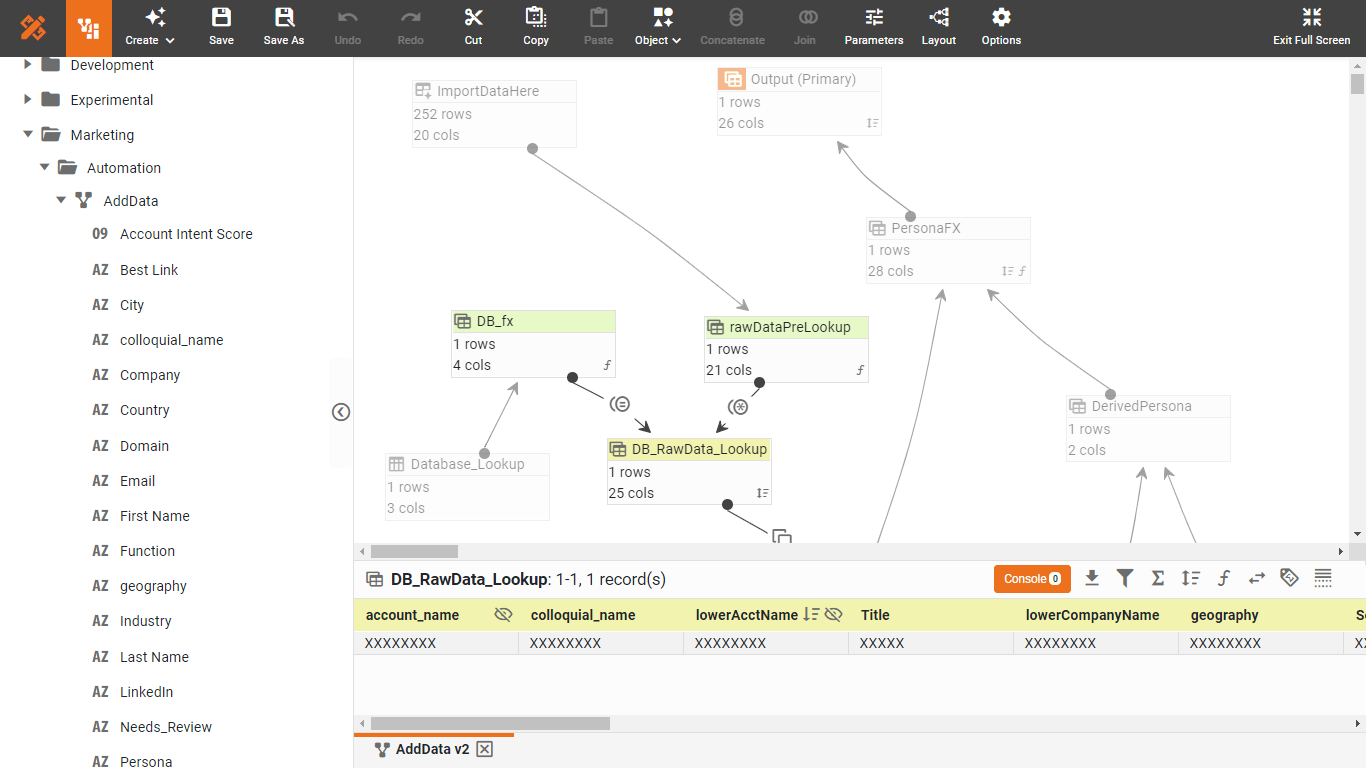
Additionally, StyleBI's query builder includes the ability to use SQL dashboard queries, in which worksheets will create a single SQL query that can fully generate a table's data. This separates InetSoft from most business intelligence software because many other platforms have databases run on their own encrypted servers, and as such, they cannot use SQL to create queries. StyleBI's SQL dashboard queries, while optional, offer greater data visualization accessibility to companies who use SQL servers or Oracle.
Kelp Processing and Extraction Firm Switching from DbVisualizer to StyleBI for Web-Based Query Building
A mid-sized kelp processing and extraction company, specializing in producing nutraceuticals, cosmetics, and biofertilizers, faced growing challenges with their data analytics infrastructure. For years, the firm relied on DbVisualizer for querying relational databases and generating reports. While DbVisualizer offered a robust desktop-based environment for SQL query writing and database exploration, its limitations became increasingly apparent as the company’s operational and analytical needs expanded. The management team recognized that the organization needed a more flexible, web-based solution that could empower both technical and non-technical users while scaling to meet future data requirements. After an extensive evaluation, the firm selected InetSoft’s open source StyleBI for its web-based query builder and self-service analytics capabilities.
Challenges with DbVisualizer
DbVisualizer had served the company well in its early stages, providing a reliable interface to query SQL databases, perform joins, and generate simple reports. However, the solution was primarily desktop-based, which created several challenges for a growing company:
- Limited accessibility: Analysts had to install DbVisualizer locally, making it difficult for remote staff or cross-department teams to access the platform without VPNs or desktop clients.
- Steep learning curve for non-technical users: While SQL experts thrived with DbVisualizer, business users and operations managers often struggled to write queries or manipulate data independently.
- Fragmented reporting: Each analyst maintained local query files and exported results to spreadsheets, creating inconsistencies and version control issues.
- Integration limitations: DbVisualizer was designed for database exploration, not for embedding analytics into internal web portals or dashboards. Sharing insights across departments required manual exports and presentations.
- Scalability constraints: The growing volume of kelp harvest data, extraction process metrics, and production logs demanded faster query performance and centralized access to datasets, which DbVisualizer could not fully provide.
These challenges prompted the firm to explore alternatives that would allow broader adoption, more agile reporting, and a more collaborative analytics environment. After considering several business intelligence tools, the company identified StyleBI as a suitable replacement, particularly because of its web-based query builder and open-source model.
Why StyleBI Was Selected
StyleBI offers a combination of features that align closely with the company’s evolving analytics requirements. Several factors influenced the decision:
- Web-based accessibility: Unlike DbVisualizer, StyleBI runs entirely in a web browser, providing universal access to users without requiring local installations. Analysts, production managers, and supply chain personnel can access the query builder from any device, facilitating remote work and cross-functional collaboration.
- Self-service query building: The intuitive drag-and-drop interface enables non-technical users to create complex queries and reports without SQL expertise. This empowers business teams to explore kelp harvest data, extraction yields, and production metrics independently.
- Data mashup capability: StyleBI supports combining multiple data sources in real-time. For the kelp processing firm, this means analysts can integrate harvest logs, lab test results, inventory records, and sales data into unified queries and dashboards without relying solely on IT.
- Open-source model: The company values transparency and customization. StyleBI’s open-source framework allows internal IT teams to modify features, integrate custom connectors, and extend functionality according to evolving business requirements.
- Scalability and performance:StyleBI’s architecture can handle large datasets efficiently. As the kelp processing firm collects more operational and extraction data, the platform can scale horizontally to support additional users and higher query loads.
Implementation Process
The transition from DbVisualizer to StyleBI was approached methodically to minimize disruption. The implementation followed several key phases:
1. Data Inventory and Assessment
The first step involved a comprehensive inventory of all data sources currently accessed through DbVisualizer. This included SQL databases containing kelp harvest records, lab analysis results, supply chain logs, production metrics, and sales information. Each dataset was assessed for quality, consistency, and integration requirements. The IT team identified opportunities to streamline schemas and consolidate redundant tables to optimize queries in StyleBI.
2. Platform Installation and Configuration
StyleBI was deployed on the firm’s internal cloud infrastructure, providing secure access to authorized personnel. The IT team configured database connections, set up user authentication, and established role-based access control to ensure sensitive operational and financial data remained protected. Custom templates and reusable query components were defined to speed up future report creation and promote consistency across departments.
3. Training and Knowledge Transfer
Transitioning to StyleBI required educating both technical and non-technical users. IT conducted training sessions for SQL analysts, showing how to leverage the query builder to replicate existing DbVisualizer queries. Business users attended workshops focused on drag-and-drop query construction, filtering, aggregation, and visualization. Hands-on exercises helped users build confidence in generating reports independently, reducing reliance on IT.
4. Data Migration and Validation
Existing reports and queries from DbVisualizer were migrated to StyleBI. Analysts verified the accuracy of outputs against historical results to ensure consistency. The validation process included checking joins, calculations, filters, and aggregates, with adjustments made to accommodate StyleBI’s data block mashup logic.
5. Dashboard Creation and Collaboration
With queries in place, the firm leveraged StyleBI’s dashboarding capabilities to create real-time operational dashboards for production, extraction efficiency, and supply chain monitoring. These dashboards were shared with department heads, enabling faster decision-making and more proactive operational management. StyleBI’s web-based environment facilitated collaborative review, allowing managers and analysts to annotate dashboards, suggest improvements, and track changes over time.
Benefits Realized
The transition to StyleBI delivered immediate and long-term benefits for the kelp processing firm:
- Increased productivity: Business users could generate reports independently, reducing the workload on SQL analysts and IT personnel.
- Faster decision-making: Real-time dashboards and query results enabled managers to monitor extraction efficiency, inventory levels, and sales trends without delays.
- Enhanced collaboration: Web-based access allowed teams across harvest, lab, production, and sales departments to collaborate effectively and share insights in a single platform.
- Cost savings: By leveraging an open-source solution, the company avoided recurring per-user licensing fees associated with commercial BI platforms.
- Scalable architecture: The platform could handle increasing data volumes from expanding harvest operations and new product lines without significant performance degradation.
- Long-term flexibility: The open-source framework enabled custom integration with emerging IoT sensors, laboratory automation systems, and ERP modules, future-proofing the analytics infrastructure.


