Comparison of Software for Generating Reports
This article provides a comparison of five reporting and dashboarding platforms: InetSoft, FastReport Mono, FineReport, QueryTree, and Telerik Reporting. The focus is on reporting capabilities, data transformation features, and enterprise‑grade security—three areas that determine whether a reporting tool can scale from small teams to large organizations.
Overview of Each Platform
InetSoft
- Enterprise‑grade reporting and dashboarding platform with a semantic layer and data mashup engine.
- Supports interactive dashboards, pixel‑perfect reports, and embedded analytics.
- Designed for organizations needing governed data access and complex transformation logic.
FastReport Mono
- Cross‑platform reporting tool built for .NET and Mono environments.
- Lightweight, developer‑friendly, and suitable for embedding into applications.
- Focuses on traditional paginated reports rather than dashboards.
FineReport
- Chinese enterprise reporting tool with spreadsheet‑style design.
- Strong in operational reporting and form‑based layouts.
- Offers both web and desktop design environments.
QueryTree
- No‑code/low‑code reporting tool aimed at small teams.
- Simple interface for connecting to databases and generating charts.
- Best suited for lightweight analytics rather than enterprise deployments.
Telerik Reporting
- .NET‑based reporting framework for developers building embedded reports.
- Supports interactive and paginated reports with strong customization.
- Often used inside custom applications rather than as a standalone BI platform.

Reporting Capabilities
InetSoft
- Supports dashboards, paginated reports, ad‑hoc reporting, and embedded analytics.
- HTML5, PDF, Excel, and mobile‑responsive output.
- Interactive filtering, drill‑downs, and multi‑level hierarchies.
FastReport Mono
- Strong in traditional paginated reporting.
- Exports to PDF, Excel, Word, and image formats.
- Limited dashboarding or interactive visualization features.
FineReport
- Spreadsheet‑like report designer with templates for forms and operational reports.
- Supports dashboards but with less flexibility than enterprise BI tools.
- Good for organizations with heavy form‑based workflows.
QueryTree
- Simple charts and tables for quick insights.
- Limited customization and no pixel‑perfect reporting.
- Not suitable for complex enterprise reporting needs.
Telerik Reporting
- Excellent for embedded reports inside .NET applications.
- Interactive sorting, drill‑downs, and parameters.
- Less suited for enterprise dashboards or large‑scale BI deployments.

Data Transformation Features
InetSoft
- Full semantic layer for reusable business logic.
- Visual and scriptable data transformation engine.
- Supports joins, unions, filters, calculated fields, and multi‑source blending.
- Real‑time mashups across databases, APIs, flat files, and cloud systems.
FastReport Mono
- Basic data filtering and parameterization.
- Transformations must be handled upstream in the database or application.
- No semantic layer or multi‑source blending.
FineReport
- Spreadsheet‑style transformations inside the designer.
- Supports formulas, joins, and simple data modeling.
- Not optimized for large‑scale semantic modeling.
QueryTree
- SQL‑based transformations or visual query builder.
- Limited to single‑source transformations.
- No semantic layer or enterprise modeling features.
Telerik Reporting
- Relies on upstream data modeling.
- Supports parameters and filtering but not multi‑source blending.
- No built‑in transformation engine.

Enterprise Security Features
InetSoft
- Role‑based access control with row‑level and column‑level security.
- Integration with LDAP, SSO, SAML, OAuth, and Active Directory.
- Secure multi‑tenant architecture for SaaS deployments.
- Audit logging, data masking, and governed semantic layer.
FastReport Mono
- Security depends on the host application.
- No built‑in enterprise identity management.
- Suitable for internal or embedded use where the application handles authentication.
FineReport
- Role‑based permissions and user groups.
- Supports enterprise authentication systems.
- Less granular than platforms with semantic layers.
QueryTree
- Basic user authentication.
- No row‑level security or enterprise identity integrations.
- Designed for small teams rather than regulated industries.
Telerik Reporting
- Security handled by the .NET application hosting the reports.
- Supports secure parameterization and data access rules.
- No standalone enterprise security framework.

Summary Comparison
Best for Enterprise BI
InetSoft stands out with its semantic layer, data mashup engine, and enterprise security. It is the only platform in this group designed for large‑scale, governed analytics.
Best for Embedded .NET Reporting
Telerik Reporting and FastReport Mono excel when developers need to embed reports inside custom applications.
Best for Spreadsheet‑Style Operational Reports
FineReport is ideal for organizations that rely heavily on form‑based reporting and Excel‑like workflows.
Best for Small Teams
QueryTree is simple and accessible but not designed for enterprise‑level reporting or security.
Complete Enterprise Solution
Each reporting tool serves a different audience. InetSoft provides the most complete enterprise solution with strong data transformation and security capabilities. FastReport Mono and Telerik Reporting are excellent for developers embedding reports into applications. FineReport offers a spreadsheet‑centric approach, while QueryTree focuses on simplicity for smaller teams. Understanding these differences helps organizations choose the right platform for their reporting, governance, and scalability needs.

More Articles About Generating Reports
General: Data Mashups in an Ideal World - What do you think of this ideal world we have been discussing? You have this array of data marts and you can essentially mix and match to create your own dashboard on the fly. Within organizations, it probably makes a lot more sense. I know others are thinking about interoperability with externalities, vendors, external users and such, and how can this internal data I have be shared in a meaningful way with others. But within an enterprise for developing mashups of all of your internal data...
Generate Automatic Reports - Automatic reports are vital for the monitoring and control of business conditions. Without robust report automation tools, the production of regular reports puts additional demands on administrators and employees. With so much business travel and work done out in the field, report accessibly and deliverability can also be an issue. InetSoft's automated reporting tool, Style Report, makes the setup and generation of automated reports easy and efficient...
Generate Batch Reports - Using InetSoft's reliable report generator software allows for the automated generation of batch reports cleanly and consistently without the headaches. InetSoft Technology provides an excellent interactive report generator software, which enables the flexible transformation of data of all types into client-customizable batch generated reports and interactive dashboards...
Generating Analytics Reports - Looking for good software for generating analytics report? InetSoft's pioneering dashboard reporting application produces great-looking web-based reports with an easy-to-use drag-and-drop designer. View a demo and try interactive examples...
Generating PDF Reports in Chinese-Japanese-Korean - The original PDF specification was designed to create documents with 8 bit characters. Since the Chinese-Japanese-Korean (CJK) characters are 16 bits, they did not fit well in a PDF document. The PDF 1.3 specification (equivalent to Acrobat 4.0 and higher) added support for CID fonts. The PDF generation in StyleBI supports CID fonts with two new classes: PDF4Printer and PDF4Generator. They correspond to the PDF3Printer and PDF3Generator. Because these two classes generate PDF documents according to PDF 1.3 specification, the output can only be viewed using Acrobat 4.0 and higher...
Generating PDF Reports with CID Fonts - We need to add the directory where the CID fonts are installed to the 'font.truetype.path' property. The directory is the place where the Asian font pack is installed, which is selectable during the installation process. This step is necessary so that the PDF4Printer can find the CID font files and extract font information. Note: The PDF4Printer uses the CMap files in addition to CID fonts. Since the CMap files are installed under the CMap directory parallel to the 'cidfont' directory, the font loading program checks the '../CMap' directory using the font.truetype.path directories. If the CID fonts are installed differently and the CMap files are placed at a different location, the CMap directory can be specified using the 'font.cmap.path' property. After the PDF4Printer is created, we need to create a mapping from the TrueType Japanese font to the CID Japanese font. The Adobe Asian Language Pack comes with two Japanese fonts: HeiseiMin-W3-Acro and HeiseiKakuGo-W5-Acro. Either can be used in the mapping...
Getting Started Using HR Reporting Software - How can you get started using HR reporting software? What are we going to help you with to give some samples to start off with. The samples that you see here are truly just that. They are samples of a variety of different reports both financial as well as HR and payroll. They are designed to give you ideas of how to write reports. These are all functional reports so you use them. You can alter them. You can change them. Do whatever you want. The way it works, you simple point to a report on the list. Click on it, and it takes you to another tab on the report in the workbook. This is an example, just a very basic employee list. The columns can be whatever you want, but this is standard stuff that we see customers wanting as far as status and position and job coding, pay rate and frequency. If you want to you, you could filter it by employer, by a variety dates. Just going through my tabs at the bottom the salary change report, well this one is written very specifically as a salary change report. But you can easily come here, and change it at the top to say a Transfer Report. And then you have the ability of editing the report just as you would a brand new one...

Global Network Performance Dashboard A dashboard for an enterprise's global network performance requires immense data sources. And InetSoft, a premium BI software vendor, has built their Style' brand software with the purpose of handling big data with ease. Some of the features of the InetSoft flagship product, StyleBI', were made to deal with problems specific to...
Good Business Analyst Reporting Application - Looking for a good business analyst reporting application? InetSoft is a pioneer in self-service reporting and makes it easy to create analytical dashboards with a drag and drop designer. View a demo and try interactive examples...
Good DB Reporting Tool -
Are you looking for a good database reporting tool? Since 1996 InetSoft has been making reporting software
that is easy to deploy and easy to use. Build self-service oriented interactive dashboards quickly. View a
demo and read reviews...
Good Discussion about Data Mashups vs. Data Warehouses - With the typical data warehouse scenario, if one thing goes wrong, the whole system comes down to its knees. There’s a huge dependence on the IT side before any other business can get done. Whereas if you flip the situation on its head and focus more on the self-service you get the users to respond and react quickly in tune to their own needs and then worry about the performance of those queries after the fact with appropriate technologies like column-based databases, temporary caches, even data grids for processing things in parallel, something like a Map/Reduce technique...
Good Reporting Tools - InetSoft’s StyleBI features a state-of-the-art reporting engine that allows for the easy creation of pixel-perfect paginated reports that can draw on data from virtually any desired source...
Good Report Designer - Reporting has always been tightly coupled to everyday business activities. As a result, reporting requirements tend to change very often. Traditionally, when such changes occurred, you were forced to rely on developers or IT staff to revise your reports to meet the new requirements. Not only does our software, Style Intelligence™ enable the creation of production reports and supports end-user driven ad hoc reporting, it also enables writing back to databases. So now you can quickly build reports, based from the web, that can both visualize and update data. Build reports from almost any data source and provide controlled forms for updating or inputting information. InetSoft believes the solution to this problem is user empowerment. Instead of requiring you to communicate your needs to developers and then iterate over successive changes, Style Intelligence™ gives you direct access to powerful reporting software tools that allow you to rapidly and easily design your reports yourself. Other BI tools have previously attempted to provide functional reporting. However, these tools have not reached a significant level of prevalence due to the following factors...
Good Reporting User Interfaces - A lot of good reporting user interfaces have what’s called the suffix and prefix property. They can be attached to any report you save. So that may be something that you could add. And allow users to access archived reports to export them as needed so current reports, but there should also be perhaps a listing of archived reports, perhaps someone must look at things historically. And here’s a quick bit on printing. Would this work on paper? So when you are actually developing a report, ensure that the same information is included in all formats. So don’t include information in one printable format and not in the other, it should be consistent across the board. And again, with regards to working on paper, just make sure that you are following the guidelines set forth by organization whether it's 8.5x11. Perhaps there's a long report format that you have standardized on, but work within that. And again going back to color coding, colors alone should not contain any information because more times than not people are going to be printing black and white. So keep that in mind. So as you can see, these key areas that we have gone through can all incorporate best practices for report writing. We have discussed a few of them today...
Great Secrets of Efficient Report Writing - Now, I’ve written a lot of reports, and I am sure the majority of our attendees today are have, too. One of the great secrets of efficient report writing is being able to utilize existing reports where you can take an existing report that’s 80% of what you want and then further modify it to create a brand new report that meets the new reporting need. Perhaps you delete some columns, add some data elements, add a filter, that sort of thing and then save it as a different name. You still have your original report, but now you have a different report based on that original format. That’s exactly what you can do with these report templates. If I move back and look at some of our financial reports, the next one is the asset register. This is a report analyzing fixed assets data. Let’s say you want to remove physical location and replace that with accounting location. You could simply open this report definition, make that change, save it under a different name, and now you have two different reports. If I move on to a vendor list by name, that’s a pretty standard report there. The vendor profit and loss report is another one with some groupings and sub totals, again with all of the filters...

Grouping and Summarization - InetSoft "Style Report" Enterprise, as a reporting tool, is an edition of StyleBI that focuses on enterprise reporting. It provides production reports, interactive reports and ad hoc reports in a zero client, web environment. This application meets the needs for anyone searching for ad hoc reporting, J2EE reporting and Web based reporting. When you have added a grouping field, you can set the sort order as ascending, descending, or original order. For a date-time field, you can group by day, month, year, etc. Named Groups can be used to create a coarser grouping in which multiple field values are placed into a single group. Predefined Named Groups, created in a Data Worksheet, can also be used. See Creating a Named Grouping in the Data Worksheet Guide for more information. The ‘Top N’ sub-pane is used to narrow down the data set to display only a specified number of groups from a grouping column when the data is sorted by the values in one of the summary columns. ‘Top N’ will display the highest groups, ‘Bottom N’ will display the lowest groups, and ‘Sort All’ sorts all of the groups without selecting a certain number...
Grouping and Summarization of Tabular Data - This section discussed grouping and summarization of tabular data. Many business reports require some processing on the raw data before presenting them as tables. The most common processing is the grouping and summarization of table rows. This is usually a post data retrieval operation and takes place after the data is loaded into a lens object and bound to an element. Sorting and grouping of tables is by far the most common operation in business reports. Grouping is dependent on the sorting of grouping columns. After row grouping is produced, further processes can be performed, such as finding the top N groups from the grouped results. Sorting of tables is ideally done by a database. When a data set is large, however, sorting in memory may be impossible. There are two classes in StyleBI that produce a sorted table. Grouping in StyleBI consists of two functions: grouping of rows based on one or more columns and summarization on the grouped sections. If grouping is based on one column, all rows with the same value on that column are grouped into one section...
Guided Ad Hoc Reporting Is Like eBay - So let me make an analogy, if the slicing and dicing, multidimensional analysis is like using Excel. You got a real power user. They understand what they are doing, but it’s a business intelligence tool. It looks the same from place to place to place. It’s just working on different data. Guided ad hoc reporting is a lot more like doing something with eBay-like application of sorts. eBay has a purpose. Its purpose is to sell products or buy products online, and with ad hoc analysis its very similar. You get to chose the kinds of things you want to look at. You have drop down boxes and radio buttons, and its very simple web-based interfaces that are easy to understand. There are no surprises with guided ad hoc analysis. Because you have a lot of choices with those drop down boxes and check boxes and radio buttons, you can do a lot of manipulation there, but you’re not going to hurt yourself. You’re not going to get yourself in a situation where you don’t even know how you got to this place. That’s because the parameters are all right there on the screen...

Hadoop Graphical and Report Tools - Looking for good hadoop graphical report tools? InetSoft's pioneering dashboard reporting application produces great-looking web-based dashboards visualizations for Hadoop environments with an easy-to-use drag-and-drop designer. View a demo and try interactive examples...
Health Informatics Software - In healthcare there is an immense amount of data to manage and keep track of. Not only do you need to monitor patients medical histories but there is a large and ever increasing demand for appointments which leads to scheduling and employee data metrics. Healthcare IT also encompases many other critical facets including security measures in electronic health records. This is why the health informatics profession is vital for maintaining a viable healthcare system...
Healthcare Reporting Software - The management of hospitals, clinics, and independent healthcare providers all involve tracking factors such as patient complaints, nurse and employee turnover rates, and more. When using basic office programs like Excel or SQL database software, processes of analysis are often cumbersome and prone to human error...
Helpdesk Reporting Tool for Freshdesk - Looking for a good solution for Freshdesk dashboard reporting? InetSoft's pioneering BI application produces great-looking cloud-based dashboards with an easy-to-use drag-and-drop designer. View a demo and try interactive examples...
Helpdesk Reporting Tool for LiveAgent - Looking for a good solution for LiveAgent dashboard reporting? InetSoft's pioneering BI application produces great-looking cloud-based dashboards with an easy-to-use drag-and-drop designer. View a demo and try interactive examples...
Hospital Reporting Example Using Vertica - The hospital reporting example that we heard was one of Vertica plus InetSoft, and we have a lot of customers that use Vertica as the underlying database and analytics engine and then InetSoft as the visual and BI tool on top of it. Why do companies choose InetSoft? I think to start InetSoft provides incredibly fast query performance. Most of our customers experience 10 to 50 times faster query performance or more compared to their legacy systems. InetSoft is able to handle queries speeds very, very quickly. It's also highly scalable handling massive workloads at high speed. Many of our customers are storing hundreds of terabytes or even petabytes of data in Vertica and running queries against that data 24x7. And since it an SQL based platform there is no need to learn new languages, or add complexity to your data stacks and even the Machine Learning algorithms that we have built out in InetSoft utilize very simple SQL calls. And finally InetSoft leverages advanced compression and commodity infrastructures, so you can see dramatically lower total cost of ownership without sacrificing that analytic performance that you rely on. And I will talk little bit more about the specific cost savings that some of our customers are experiencing in the few slides...

How Ad Hoc Reporting Is Used By Marketers - Ad hoc reporting refers to the process of creating reports on an as-needed basis, rather than following a predetermined schedule. This type of reporting is a valuable tool for marketers, as it allows them to quickly gather information and analyze data in real-time, allowing them to make informed decisions and respond to changing market conditions quickly. Ad hoc reporting can be used in a variety of ways by marketers. For example, it can be used to track customer behavior and purchase patterns, allowing marketers to gain insights into customer preferences and buying habits. This information can then be used to create targeted marketing campaigns that are tailored to specific customer segments, increasing the effectiveness of marketing efforts and driving sales. Ad hoc reporting can also be used to monitor the performance of marketing campaigns in real-time. By tracking key metrics such as website traffic, click-through rates, and conversion rates, marketers can quickly identify areas of strength and weakness and make necessary adjustments to optimize campaign performance. This helps marketers ensure that their campaigns are reaching the right audience, generating the desired results, and providing a positive return on investment...
How Are KPI Reporting Tools Used in Professional Sports? - Key Performance Indicator (KPI) reporting tools play a crucial role in professional sports organizations by helping them track and analyze various performance metrics to improve team performance, player development, and fan engagement. Here are some KPI reporting tools commonly used in professional sports: Sports Analytics Software: There are various sports analytics software platforms that cater to different needs, such as Catapult Sports and Sportscode. These tools allow teams to collect and analyze data on player performance, game strategy, and injury prevention. Player Tracking Systems: Tools like Zebra Sports Solutions and Second Spectrum provide real-time tracking of players' movements during games. This data is used to analyze player positioning, speed, and distance covered, helping teams make data-driven decisions. Performance Analysis Software: Companies like Sports Insights and Instat provide software that helps teams break down game footage to analyze player and team performance. Coaches can use these tools to review specific plays and make tactical adjustments...
How to Create an Executable Report - Replets are organized in a hierarchical structure in the repository. There can be any number of levels in the tree. The leaf nodes of the tree are replets and non-leaf nodes are folders. A non-leaf node can be empty, in which case it is simply an empty folder (with no reports in it). The tree position of a replet is encoded in the replet name. A replet name is a full path from the root of the tree to the replet leaf node. Each node is separated by a slash '/'. For example, the replet 'Replet2' in a top-level folder, 'Sales', would have the name 'Sales/Replet2'. Whenever a replet is referenced in a Java program or as a URL, the full name must be used. Because the entire tree structure is encoded in the replet full name, changing the name of a replet could have the effect of moving it among the branches of the tree. Although the name of the replet resembles a file path, it has no relationship to the location of the file on the file system. Neither does it have any relationship to the package a replet belongs to. A replet class is loaded as a regular Java class. As long as the class is accessible from the CLASSPATH, it does not have to be placed in any particular directory structure...
How to Create an Interactive Business Report for a Chief Strategy Officer - When reviewing a business report, a CSO is interested in gaining actionable insights to inform strategic decision-making. Here are the key elements and information a CSO would typically look for in a business report: Executive Summary: Concise overview of the report's main findings and recommendations. High-level summary of key performance indicators (KPIs) and metrics. Objective and Scope: Clear statement of the report's purpose and the specific areas it covers. Explanation of the timeframe or period covered by the report. Market Analysis: Market trends and dynamics affecting the industry. Competitive landscape, including market share analysis and key competitors' strategies...
How to Create a Finance Dashboard Report - This article will explain how to create a finance dashboard such as the one below using dashboard creation software from InetSoft. A working version of this dashboard can be found on the InetSoft Gallery. We will first consider the following chart, which shows the overdue invoice count and amount in dollars. The Chart is important because it shows an interesting divergence in the number of late invoices and the corresponding amounts. While there are fewer overdue invoices at longer overdue intervals, the average value of those long-overdue orders tends to be higher. Press the Edit button on the Chart to open the Chart Editor...
How to Create a Leads Summary Report - This document will explain how to create a Leads Summary Report using report creation software from InetSoft. A working version of this report can be found on the InetSoft Gallery. This report consists primarily of a single chart and a single crosstab, along with a variety of text. Below, we will examine how you can create these different components using the browser-based Ad Hoc Reporting feature. InetSoft provides two different tools for creating reports. The first tool, Style Studio, is a desktop application that provides a full-featured environment for creating pixel-perfect production reports and report components such as scripts, table styles, beans, and templates. This tool is well-suited for professional report developers. The second tool, the Ad Hoc Reporting app, is a browser-based tool intended for end-user report design. It offers the most commonly-used reporting features and is targeted at business users who need to rapidly create custom reports to suit immediate needs...
How Do Actuaries Use Tools for BI Reporting? - Actuaries use BI reporting tools to perform various tasks such as: - Creating and visualizing input tables for financial models and regulatory reports. - Analyzing data from internal and external sources to learn about market trends, customer demographics, and risk factors. - Automating and streamlining month-end, quarter-end, and year-end reporting tasks. Some of the most popular BI reporting tools used by actuaries are InetSoft, Tableau, Power BI, R, and Python. These tools allow actuaries to create interactive dashboards, perform advanced statistical analysis, and integrate data from multiple sources...
How Do EHS Managers Use Reporting Tools? - EHS (Environmental, Health, and Safety) managers rely on reporting tools to effectively manage their organization's safety, environmental, and regulatory compliance programs. The functions they do are: Communicating Safety and EHS Performance: Effectively communicating EHS performance to management, employees, and external stakeholders. Compliance Management: Tracking regulatory requirements, monitoring compliance status, and generating compliance reports. Data Visualization: Creating charts, graphs, and dashboards to visualize EHS trends and identify areas of concern. Enhancing Regulatory Compliance: Demonstrating compliance with environmental and safety regulations to stakeholders. Hazard Identification and Assessment: Logging and documenting hazard identification findings, risk assessments, and corrective actions...
How Do Environmental Consultants Use Web Application Reporting Tools? - Environmental consultants play a crucial role in assessing and managing environmental risks and impacts for businesses, organizations, and government agencies. Reporting tools are instrumental in their work, providing a structured and comprehensive way to convey findings, recommendations, and compliance status. Here's how environmental consultants use reporting tools: Regulatory Compliance Reporting Environmental consultants must ensure that their clients comply with local, state, and federal environmental regulations. Reporting tools help generate detailed compliance reports, outlining adherence to specific environmental laws and standards. Environmental Impact Assessments (EIAs) When a project or development is planned, consultants conduct EIAs to evaluate potential environmental impacts. Reporting tools are used to document the assessment process, findings, and proposed mitigation measures. Air Quality Reports Consultants monitor air quality to assess pollutants and emissions. Reporting tools help compile and present data on air quality levels, emissions, and compliance with air quality standards set by regulatory bodies. Water Quality Analysis Consultants evaluate water bodies for pollutants, contaminants, and overall quality. Reporting tools assist in presenting the results of water sampling, analysis, and recommendations for improvement or remediation...
How Do InetSoft and MicroStrategy Compare in Terms of Production Reporting Functionalilty? - InetSoft and MicroStrategy are both renowned providers of business intelligence (BI) and analytics solutions, each offering unique features and capabilities. When comparing their production reporting functionality, several factors come into play: Ease of Use and Flexibility: InetSoft: InetSoft's reporting tools are known for their intuitive interface and user-friendly design, making it easy for business users to create and customize production reports without extensive technical knowledge. The platform offers flexibility in data visualization and formatting options, allowing users to tailor reports to their specific requirements. MicroStrategy: MicroStrategy provides a comprehensive set of reporting tools with a focus on enterprise-grade functionality and scalability. While powerful, the platform may have a steeper learning curve for non-technical users due to its robust feature set and advanced capabilities. However, once mastered, MicroStrategy offers extensive customization options and flexibility in report design. Data Connectivity and Integration: InetSoft: InetSoft offers connectivity to a wide range of data sources, including relational databases, OLAP cubes, flat files, and web services. The platform supports seamless integration with various data repositories, enabling users to access and analyze data from disparate sources within their production reports. MicroStrategy: MicroStrategy excels in data connectivity and integration capabilities, offering native connectors to popular databases, data...
How Do Management Consultants Use Reporting Software? - Management consultants use reporting software as a crucial tool in their work to provide valuable insights and recommendations to their clients. Here's a detailed overview of how they utilize reporting software: Data Collection and Aggregation Consultants use reporting software to gather data from various sources. This can include financial reports, customer surveys, market research, and internal documents. The software helps in aggregating this data into a centralized platform, making it easier to analyze and draw meaningful conclusions. Data Cleaning and Validation Raw data often needs cleaning and validation to ensure accuracy and reliability. Reporting software allows consultants to identify and rectify inconsistencies or errors in the data. This step is crucial for generating reliable insights and recommendations. Data Analysis and Visualization Reporting software offers robust analytical capabilities. Consultants can perform complex analyses, such as trend analysis, regression analysis, and segmentation. The software allows for the creation of visual representations like charts, graphs, and dashboards. This aids in presenting complex information in a clear and easily understandable format...
How Does a Church Administrator Use Database Reporting Tools? - A Church Administrator can utilize a database reporting tool in various ways to streamline operations, enhance communication, and make informed decisions. Here's a detailed overview of how a Church Administrator can use a database reporting tool: Membership Management: Member Profiles: The database tool can store detailed information about church members, including names, contact details, family connections, and participation in various church activities. Attendance Tracking: The tool can generate reports on attendance for services, classes, events, and special programs. This data helps in understanding member engagement and planning future events. Financial Management: Donations and Tithes: The tool can record and track contributions, generate financial reports, and provide insights into giving trends. This enables administrators to budget effectively and plan outreach initiatives. Expense Tracking: It can also be used to monitor expenses related to operations, events, and projects. Reports can help in budget allocation and expense optimization...
How Does the Head of Food and Beverage Use Ad Hoc Reporting? - The Head of Food and Beverage (F&B) in the hospitality industry can utilize ad hoc reporting as a valuable tool to enhance decision-making, optimize operations, and improve customer satisfaction within their department. Ad hoc reporting refers to the process of creating customized and on-demand reports that address specific questions or scenarios not covered by regular, predefined reports. Here's how the Head of F&B can use ad hoc reporting effectively: Menu Optimization: Ad hoc reporting can be used to analyze sales data and customer preferences to optimize the menu offerings. By generating reports that show which dishes are selling well and which are underperforming, the Head of F&B can make informed decisions about menu adjustments, seasonal changes, and promotions. Inventory Management: Ad hoc reports can assist in monitoring inventory levels and predicting demand for various ingredients. By analyzing consumption patterns and comparing them to inventory levels, the Head of F&B can avoid stockouts, reduce food wastage, and ensure that the kitchen operates smoothly. Special Events and Promotions: When planning special events or promotions, the Head of F&B can create ad hoc reports to analyze past performance and predict potential outcomes. These reports can help in making pricing decisions, allocating resources, and ensuring that the event aligns with customer preferences...
How Does InetSoft's Reporting Platform Automatically Balance Loads Among Cluster Servers? - InetSoft's reporting platform, like many other enterprise-grade reporting and analytics solutions, typically employs various strategies to automatically balance loads among cluster servers. Load balancing is crucial for ensuring optimal performance, scalability, and reliability in distributed environments.: Round Robin: This is one of the simplest load balancing algorithms where requests are distributed among servers in a cyclic manner. Each server in the cluster gets an equal share of incoming requests over time. While easy to implement and understand, it may not always result in the most efficient distribution, especially if servers have varying capacities or workloads. Least Connection: In this approach, new requests are sent to the server with the fewest active connections. This helps to evenly distribute the workload based on the current load on each server. It's particularly useful when the servers have different capacities or when there are variations in the complexity of requests. Weighted Round Robin: Similar to the Round Robin approach, but with the capability to assign different weights to servers based on their capacity or capabilities. Servers with higher weights receive more requests compared to those with lower weights. This allows for more fine-grained control over load distribution, enabling administrators to prioritize certain servers over others...
How Does a Law Enforcement Analyst Use a Custom Report Tool? - Temporal Analysis: Use the tool to conduct temporal analysis, examining how certain events or activities change over time. Generate timelines or heat maps to visualize temporal patterns and correlations. Geospatial Analysis: Leverage geospatial capabilities to map crime locations, identify hotspots, and analyze spatial relationships. Overlay additional contextual data, such as demographic information or known criminal associates, to enhance understanding. Pattern Recognition: Apply analytical models and algorithms within the custom report tool to identify patterns, anomalies, or trends that may not be immediately apparent. Explore relationships between variables and entities to uncover hidden connections. Case Linkage: Use the custom report tool to link related cases or incidents, helping to establish connections between different criminal activities. Identify commonalities in modus operandi, suspects, or locations...
How Does a Marketing Agency Deliver Customized Reports to Its Clients? - Here's a general overview of how this process works: Data Collection and Integration: The first step is to gather relevant data from various sources. This could include data from advertising platforms (like Google Ads, Facebook Ads), website analytics (Google Analytics), social media insights, email marketing platforms, and more. The agency needs to ensure that data is accurate, up-to-date, and covers the necessary metrics for the specific client's goals. Data Analysis: Once the data is collected, it needs to be analyzed to extract valuable insights. This involves identifying trends, patterns, and correlations within the data. The agency's analysts use various tools and techniques to interpret the data and draw meaningful conclusions. Report Customization: Based on the client's goals and preferences, the agency customizes the report to include the most relevant metrics and insights. Different clients have different key performance indicators (KPIs) and objectives, so the report must align with these specific goals. Customization might involve selecting specific data points, metrics, visualizations, and other relevant details. Data Visualization: Visualizing the data helps in presenting complex information in an easily understandable format. The agency can use charts, graphs, tables, and other visual elements to convey insights more effectively. Visualization tools like InetSoft, Tableau, Power BI, or even spreadsheet software (like Microsoft Excel or Google Sheets) can be used for this purpose...

How Does a Quality Assurance Engineer at a Textile Mill Use Interactive Reporting Tools? - A Quality Assurance Engineer at a textile mill plays a critical role in ensuring the production of high-quality textile products. Interactive reporting tools can significantly enhance their ability to monitor, manage, and improve quality control processes. Here's how a Quality Assurance Engineer can effectively use these tools: Real-time Monitoring: Interactive reporting tools provide real-time data on various quality metrics during the manufacturing process. Engineers can monitor parameters such as thread tension, fabric thickness, color consistency, and defect rates as they change in real-time. This allows for immediate intervention if deviations or defects are detected, minimizing waste and ensuring product quality. Defect Tracking: These tools enable engineers to log and track defects systematically. They can categorize defects by type, severity, and location on the textile product. Over time, this data helps identify recurring issues and their root causes, leading to targeted process improvements. Process Optimization: Quality Assurance Engineers can use interactive reports to analyze historical data and identify trends or patterns in quality issues. For example, if certain defects are consistently associated with a specific machine or operator, the engineer can take corrective actions such as retraining operators or conducting maintenance on the machine. Supplier Evaluation: Textile mills often source raw materials from various suppliers. Interactive reporting tools can be used to assess and compare the quality of materials from different suppliers. Engineers can track the performance of suppliers by analyzing data on material defects, delivery times, and adherence to quality standards...
How Does a Television Broadcast Scheduler Use Interactive Reporting Tools? - A television broadcast scheduler relies heavily on interactive reporting tools to ensure smooth and efficient operation of the broadcasting schedule. These tools play a crucial role in decision-making, audience engagement, and overall performance evaluation. Here's a detailed breakdown of how a television broadcast scheduler might use interactive reporting tools: Real-time Monitoring: Interactive reporting tools provide real-time data on viewership metrics, allowing the scheduler to monitor audience engagement as programs air. This helps in making instant adjustments to the schedule if needed, such as extending or shortening a program. Some key metrics commonly used by television broadcasters are: Viewership Ratings: This is perhaps the most fundamental metric, representing the number of people who watched a particular program or channel during a specific time period. It's often broken down by demographics (age, gender, location) to provide more detailed insights. Time Spent Viewing (TSV): TSV measures how long viewers stay tuned in to a particular program or channel. Longer TSV indicates higher engagement with the content. Reach: Reach is the total number of unique viewers who watch a program or channel within a specific time frame. It provides an idea of how widely a program is being watched...
How Does a Transport Supervisor at a Beverage Manufacturing Company Use Interactive Reporting Tools? - A Transport Supervisor at a beverage manufacturing company plays a crucial role in ensuring the efficient movement of raw materials and finished products to and from the production facility. Interactive reporting tools can significantly enhance their ability to manage and optimize transportation operations. Here's how a Transport Supervisor can use these tools effectively: Real-time Visibility: Interactive reporting tools provide real-time visibility into transportation activities. The supervisor can monitor the status of shipments, vehicles, and drivers, allowing them to make informed decisions on the fly. This enables them to respond quickly to unexpected delays or issues, minimizing disruptions in the supply chain. Route Optimization: These tools can analyze historical data and current traffic conditions to recommend the most efficient routes for deliveries. This not only saves time but also reduces fuel consumption and transportation costs. The supervisor can adjust routes as needed based on the information provided by the tool. Performance Tracking: Interactive reporting tools allow the supervisor to track the performance of the transportation team and individual drivers. Key performance indicators (KPIs) such as on-time deliveries, fuel efficiency, and maintenance records can be monitored. This data helps in identifying areas for improvement and recognizing top-performing team members...
How Does a Website Consultant Use Report Design Software? - A website consultant utilizes report design software to create, analyze, and present data in a structured and visually appealing manner. This software allows them to compile information, generate insights, and communicate findings effectively. Here's an in-depth look at how a website consultant might use report design software: Data Compilation and Integration: A website consultant begins by collecting data from various sources. This could include website analytics, user behavior metrics, SEO reports, social media engagement data, and more. The report design software enables the consultant to integrate these diverse datasets into a unified platform. This integration helps in generating a comprehensive view of the website's performance. Data Cleaning and Preprocessing: Raw data often requires cleaning and preprocessing before it can be used effectively. This involves tasks like removing duplicates, handling missing values, and transforming data into a consistent format. Report design software provides tools to perform these tasks efficiently, ensuring that the data used for analysis is accurate and reliable. Data Analysis and Visualization: Once the data is prepared, the consultant employs various analytical techniques to derive meaningful insights. This could involve trend analysis, segmentation, correlation studies, and more. The report design software offers a range of visualization options, such as charts, graphs, heatmaps, and dashboards. These visual representations make it easier to convey complex information in an understandable manner...
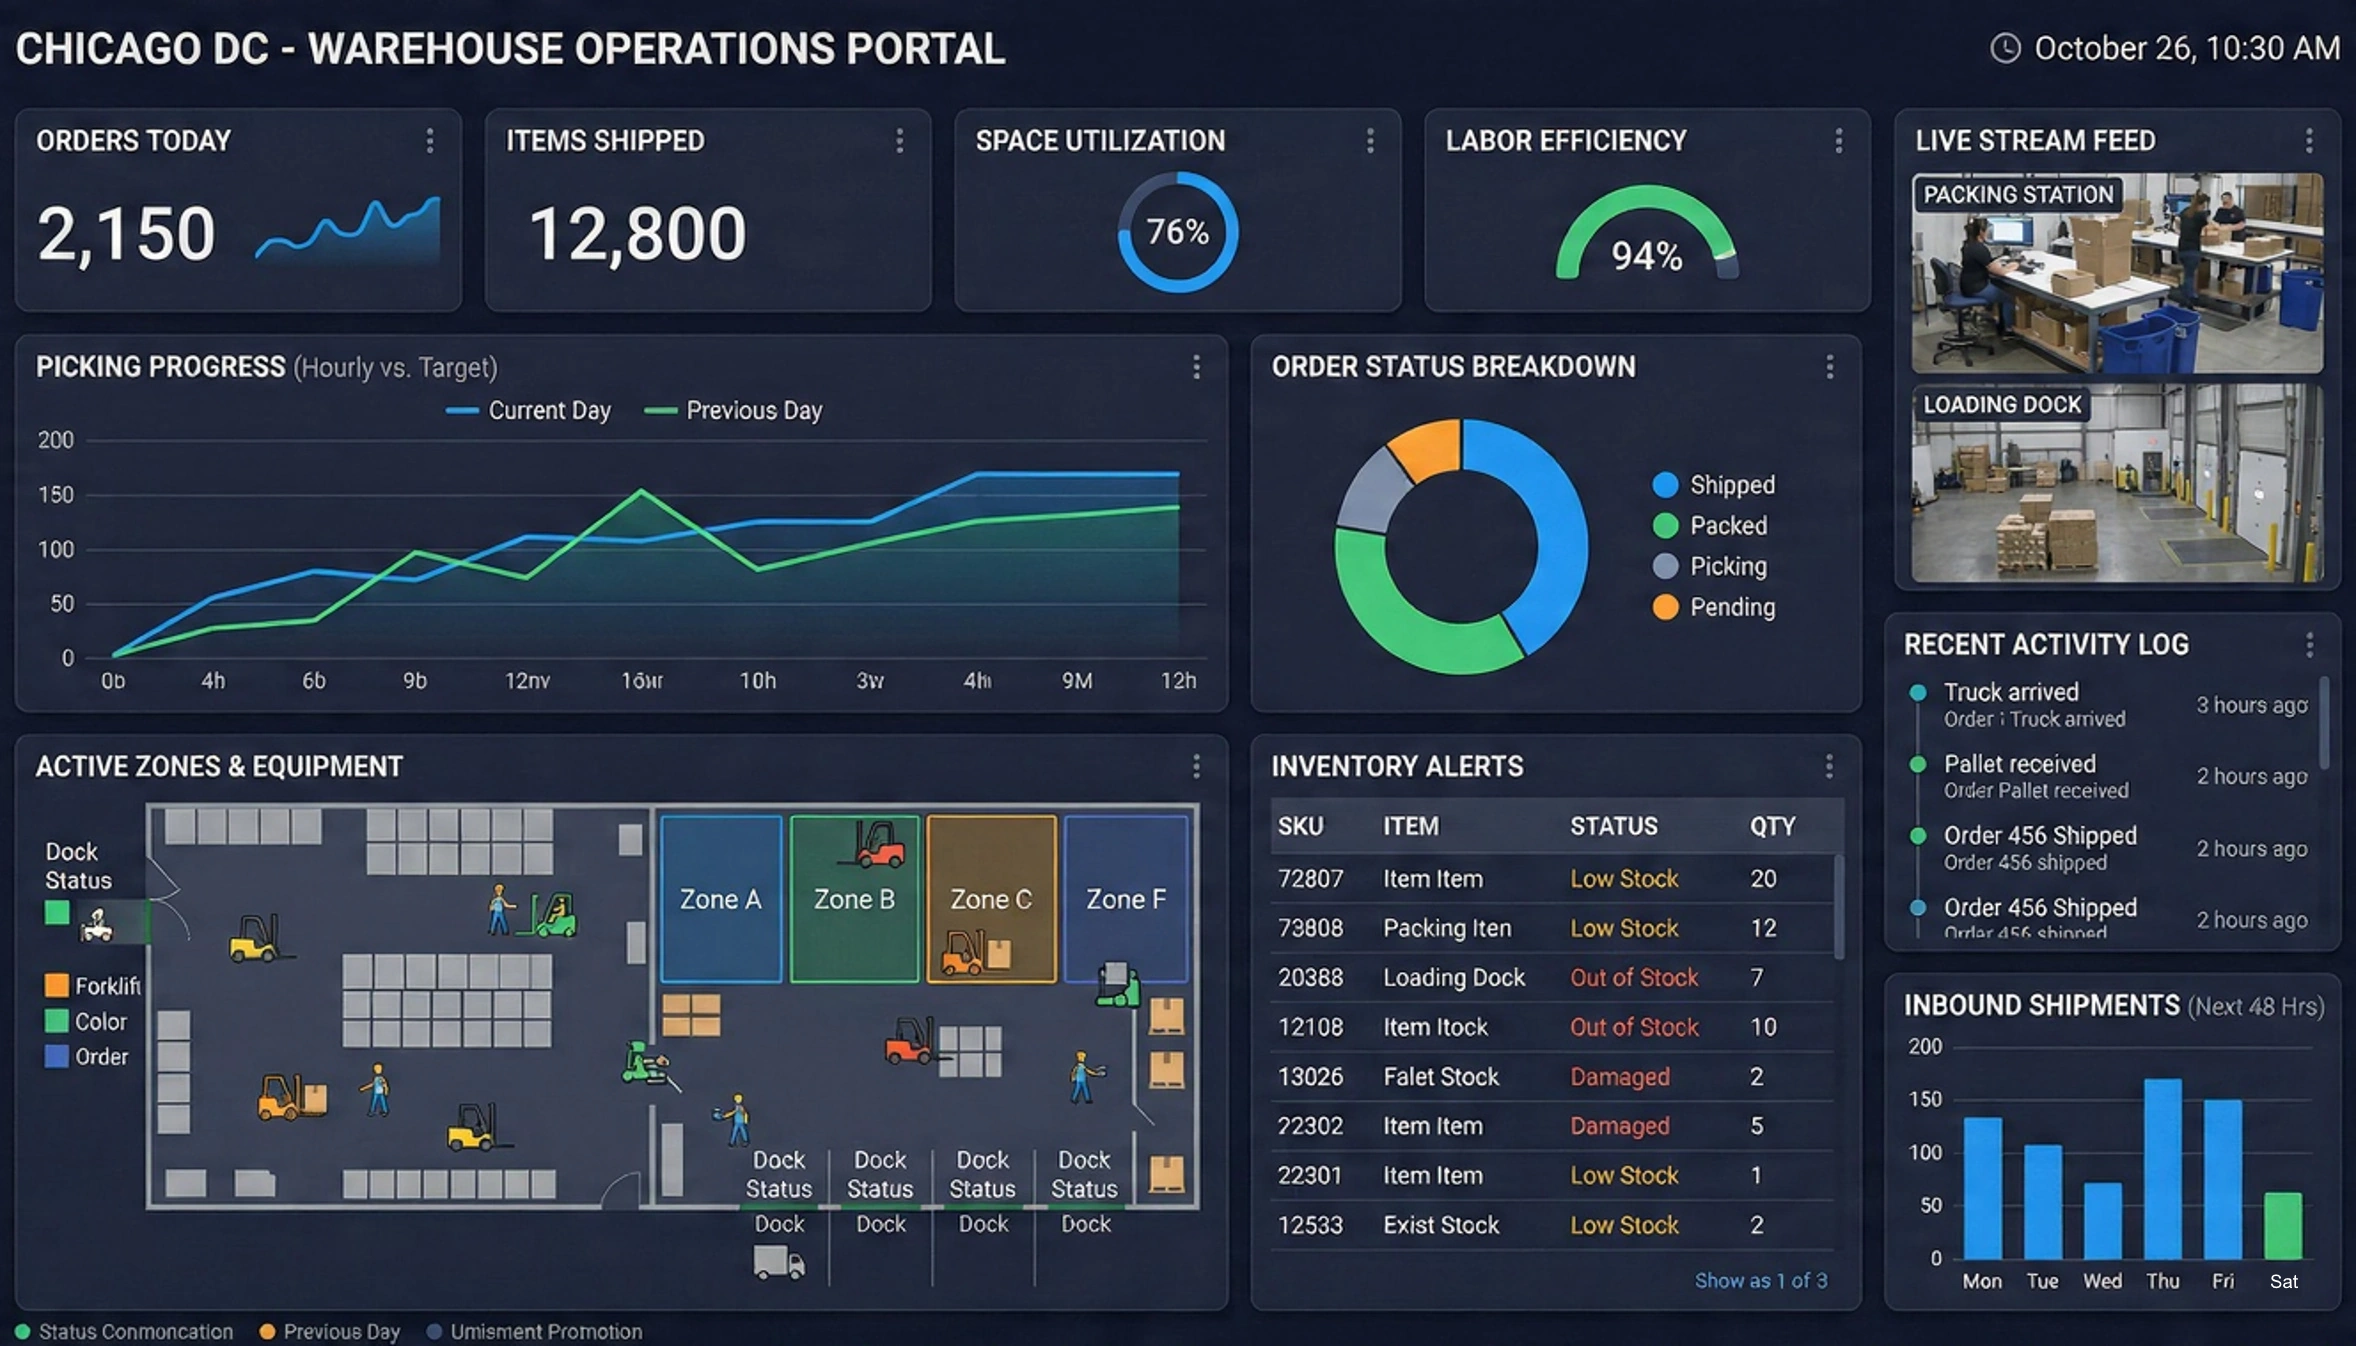
How Does a Warehouse Operations Analyst Use Reporting Tools? - A Warehouse Operations Analyst plays a crucial role in optimizing the efficiency and effectiveness of warehouse operations. Reporting tools are essential for their work as they provide valuable insights, track key performance indicators (KPIs), and support data-driven decision-making. Here's a detailed overview of how a Warehouse Operations Analyst utilizes reporting tools: Performance Monitoring: Reporting tools help Warehouse Operations Analysts monitor the overall performance of the warehouse. They can track metrics such as order fulfillment rates, inventory turnover, and on-time deliveries. This enables them to identify trends, patterns, and areas that may need improvement. Inventory Management: Reporting tools assist in monitoring inventory levels and turnover rates. Analysts can generate reports on stock levels, identify slow-moving or obsolete inventory, and optimize stocking strategies. This information helps in maintaining an optimal balance between supply and demand. Order Accuracy and Fulfillment: Analysts use reporting tools to track order accuracy and fulfillment rates. They can analyze data to identify any discrepancies or errors in the order fulfillment process. This ensures that customer orders are processed accurately and delivered on time. Labor Productivity: Reporting tools help in assessing the productivity of warehouse staff. Analysts can generate reports on key labor metrics such as picking rates, packing efficiency, and labor costs. This information assists in workforce management and optimizing staffing levels...
How Easy Is It To Modify an HR Report? - Let’s see how easy it is to modify an HR report. It’s the same thing as before. Now you want to filter the data. Simply go back in, and look at the report definition. Let’s say first we wanted to modify the report for a date range. You simply pull the period ending date to the top. Point and click. Drag and drop. Double click into the period in the filter, and say I want to do this just for the last five years. So select last year through this year, and simply hit okay. It refreshes the report. Give it a second while it does that again. It is crunching a lot of data, and now you see that the dates are all within my five year date range. It could be year. It could be quarter. It can be anything you want. And now lets say you want to get real specific. You want to know for the last five years how much overtime was paid. You can come in and you can drag the income field to the top. Double-click into that, and you may have more than one overtime code. Well, how do you do that? You simply come in, and you can either click on the code, hold down the shift key, and click the very bottom, or you can hold down the control key, and you multi select. Either way, it is fine. It’s the typical Windows functionality. Then when you hit okay, now this is going to be nothing more than an overtime report...
How to Generate Analytics Reports - Generating analytics reports is one of those tasks that sounds straightforward until you actually sit down to do it. You have data scattered across tools, stakeholders asking for different views, and a vague sense that the report should be “insightful” without anyone defining what that really means. A good analytics report is not just a collection of charts; it is a structured story that helps someone make a decision with confidence. Whether you are working with web analytics, product usage data, sales performance, or operational metrics, the process of generating analytics reports follows the same core principles. You need to clarify the purpose, define the audience, select the right data, shape it into meaningful visuals, and present it in a way that is both accurate and easy to act on. This article walks through a practical, step-by-step approach to generating analytics reports that people will actually use...
How to Make Dashboards - The first thing to learn about any BI platform is how to make dashboards. InetSoft knows this and has designed the perfect dashboard builder. InetSoft's core philosophy has been create an application that is powerful but easy to use. To the right here you can see one the fully interactive dashboards that was built using InetSoft proprietary software. InetSoft believes the ideal BI visualization program should be interactive and accessible, it should be sophisticated but it should also be learnable. Following these tenets InetSoft was able to design StyleBI', their powerful, robust and agile visualization software that's capable enough for a data scientist but easy enough to be used by a BI novice...
How A Modern Data Pipeline Helps Reporting - A modern data pipeline is a set of processes and tools that work together to extract, transform, load, and analyze data from various sources. The primary goal of a modern data pipeline is to create an efficient and reliable method for moving and processing data, enabling organizations to make data-driven decisions. Reporting is a critical function in any organization. It involves analyzing data and presenting it in a way that is meaningful and actionable. Reports can be used to monitor performance, identify trends, and make informed decisions. However, traditional reporting methods often involve manual data processing, which is time-consuming and prone to errors. A modern data pipeline can help reporting by automating many of these processes. The first step in any data pipeline is data ingestion. This involves collecting data from various sources, such as databases, APIs, and data lakes. A modern data pipeline can automate this process by using tools such as data connectors and APIs. These tools allow data to be collected from various sources, processed, and stored in a centralized location, such as a data warehouse or data lake. By automating the data ingestion process, organizations can save time and ensure that the data is accurate and up-to-date...
How The Process Of Automation Is Improving Scientific Reporting - More than 2.5 quintillion bytes of data are produced every minute. 250,000 chemical lab reports are generated every day. How many hours are wasted in this data analysis including turning data into easily digestible reports? Scientists use forty percent of their working time preparing reports rather than trying to come up with discoveries. Artificial intelligence can make a significant impact in this area. Up to 90% of reports in laboratories will be produced through AI by 2027. Even now, it is possible to perform 60% to 70% of these using technology. This includes data analysis, table generation, or graphing. For instance, the chemical analysis that once would require a couple of days or even weeks can be done in minutes using machine learning algorithms. Integrating technology, which involves the application of artificial intelligence, Smodin's AI chemistry solver, data analytics software such as InetSoft or Tableau, plus virtual labs such as Labster, help data be processed and analyzed more effectively. 90% off information developed for scientific papers will be produced with AI by 2027, increasing research productivity...
HTML, Excel, PDF, Report Output Formats - A report is generated as a PDF by default. The service also supports HTML and Excel output. To specify a different format, add a type parameter to the HTTP request. HTML output can be requested by adding a 'type=html' parameter to the URL. If the report is large and HTML output is desired, it is possible to avoid generating one large HTML page for the entire report. Instead, the generated HTML file can be broken up into pages and viewed one page at a time. To do so, specify the 'page' parameter to be a valid page number of the generated HTML file...
How the Use of Automated Reporting Tools Is Transforming RPA Development Services - Robotic process automation (RPA) is currently one of the most rapidly expanding technologies that help organizations address the issue of automating routine operational activities. Because the number of organizations that have embraced RPA as a tool for enhancing efficiency and decreasing expenses is rising, RPA development services have become popular. Although, an RPA implementation can be scaled, this becomes less easy the moment one tries to expand the process. When several bots performing assorted tasks within the organization create vast quantities of data, it becomes challenging to monitor and analyse manually. This is where advanced analytics dashboards and reporting automation becomes significant...
How Visualization Technology Makes Dashboards Better than Reports - Some of you may have noticed that dip in the European sales in the month of August, prompts that the company's European customers were off on vacation at that time and may be its just an error in the data, but overall the U.S. sales increased while Europe largely remained flat. Now, the really interesting pattern here is what was very to easy to miss with the report is that the U.S. sales seems to go up and down. This is a great illustration of how visualization technology makes dashboards better than reports. If you look at it closer, you can see it's going up by the end of the quarter, and then it goes down in the beginning of the next quarter. Up again, down, up again, down, this is a very well known pattern in sales. It's called the hockey-stick pattern. It's because of the shape of course, and the reason for this is often because sales people are driven to meet quarterly sales targets, so the work often intensifies at that time. So, this is a very good example of recognizing a pattern with visual abilities. I cannot find this pattern when I am looking at numbers that I need to store in my brain...
Hyperlinking in Web Reports - Looking for report software with hyperlinks? InetSoft is a pioneer in self-service reporting and you can embed hyperlinks in reports and dashboards. View a demo and try interactive examples...
IBM Informix Reporting Option - Looking for a good solution for Informix dashboard reporting? InetSoft's pioneering BI application produces great-looking cloud-based dashboards with an easy-to-use drag-and-drop designer. View a demo and try interactive examples...
Import and Export Report File Formats - The ability to export a report to various file formats, including PDF, Microsoft Excel, HTML, Rich Text Format and delimited text, is a very important feature of StyleBI. In this chapter we will describe how to export a report to the various formats programmatically. We will describe the PDF export in even greater detail. The process for generating a PDF is the same as printing to a printer through the Java API; however, we need to be aware of font mapping between the java.awt system and the PDF font equivalent. In this chapter, we discuss the default mapping provided with InetSoft products and how to change this default. We also explain how to embed a particular font within a PDF document. We describe how to create PDF bookmarks, and then discuss internationalization issues, particularly how to create PDF documents with CJK (Chinese, Japanese, Korean) characters. Next, we describe the use of the PDFServlet, which can be used to generate a report from a report template, and convert the file format of the report to the supported export formats...
Industrial Reporting Software - Looking for good industrial reporting software? InetSoft's pioneering dashboard reporting application produces great-looking web-based dashboards with an easy-to-use drag-and-drop designer. View a demo and try interactive examples...
Information Reporting System - Developers can now seamlessly create interactive reports with charts, tables and graphs and deliver them by integrating the reports into their business applications. Even developers with little report design knowledge can save significant time & effort in adding powerful reporting functionalities into their Web-based applications...
Informix Reporting Tool - Looking for a good solution for Informix dashboard reporting? InetSoft's pioneering BI application produces great-looking cloud-based dashboards with an easy-to-use drag-and-drop designer. View a demo and try interactive examples...
Ingres - Actian X Reporting Tool - Looking for a cost-effective solution for Actian X - Ingres dashboard reporting? InetSoft's pioneering BI application produces great-looking cloud-based dashboards with an easy-to-use drag-and-drop designer. Mashup your transaction processing data with other enterprise sources. View a demo and try interactive examples...
Inquiry and Reporting Tools - Looking for good reporting and inquiry tools? InetSoft's pioneering dashboard reporting application enables self-service for data exploration. Users need not rely on database experts to create new reports for them. View a demo and try interactive examples...
Insight Reporting Software - Looking for a insight reporting software? InetSoft, a pioneer in self-service oriented reporting software, can manage your reports. Highly rated customer service holds your hand during the entire process. View a demo and try interactive examples...

Insightly Reporting Tool - Looking for a good solution for Insightly dashboard reporting? InetSoft's pioneering BI application produces great-looking cloud-based dashboards with an easy-to-use drag-and-drop designer. View a demo and try interactive examples...
Integrating Ad Hoc Reporting into a Cloud Application - Integrating ad hoc reporting into a cloud application can provide users with the flexibility and power to generate custom reports on demand. Here are some best practices to consider when integrating ad hoc reporting into a cloud application: User-friendly interface: Design an intuitive and user-friendly interface that allows users to easily navigate and interact with the ad hoc reporting features. Provide a drag-and-drop interface or simple controls to select data fields, apply filters, and create visualizations. Secure data access: Implement proper authentication and authorization mechanisms to ensure that users only have access to the data they are authorized to view and analyze. Use role-based access control (RBAC) or similar mechanisms to manage user permissions. Data abstraction layer: Create a data abstraction layer that shields users from the complexities of the underlying data structure. This layer should provide a simplified view of the data, hiding the technical details and presenting a logical and coherent data model...
Interactive Reporting Tools - it's not uncommon for organizations to require several different BI tools: a tool for creating proper formatted paginated reports, a visual analysis tool, and tools for reformatting and massaging data to prepare the data for reports and dashboards. But what if there was a single platform, available either for embedding or for use as a standalone solution, which provided interactive online reporting, paginated reporting for printing, and unlimited data mashup and reformatting? InetSoft's StyleBI is that solution; an intuitive and robust business intelligence software that...
Inventory Reporting Tool - Looking for a good solution for inventory reporting? InetSoft's pioneering BI application produces great-looking dashboards that maximize self-service for managers and analysts. View a demo and try interactive examples...