Looking for Simple, Yet Effective Reporting Solutions?
InetSoft makes reporting simple for business users, without sacrificing functionality.With InetSoft's Style Report, reports can be created easily using a simple drag and drop interface.
Users with excel-level skills can build and customize their own reports, without help from IT.
This reporting process can be fully automated, producing reports at regular time intervals or when certain business conditions are met.
Additional functionality, such as drilldown and bursting, enables the specifics in a reports data to be explored.
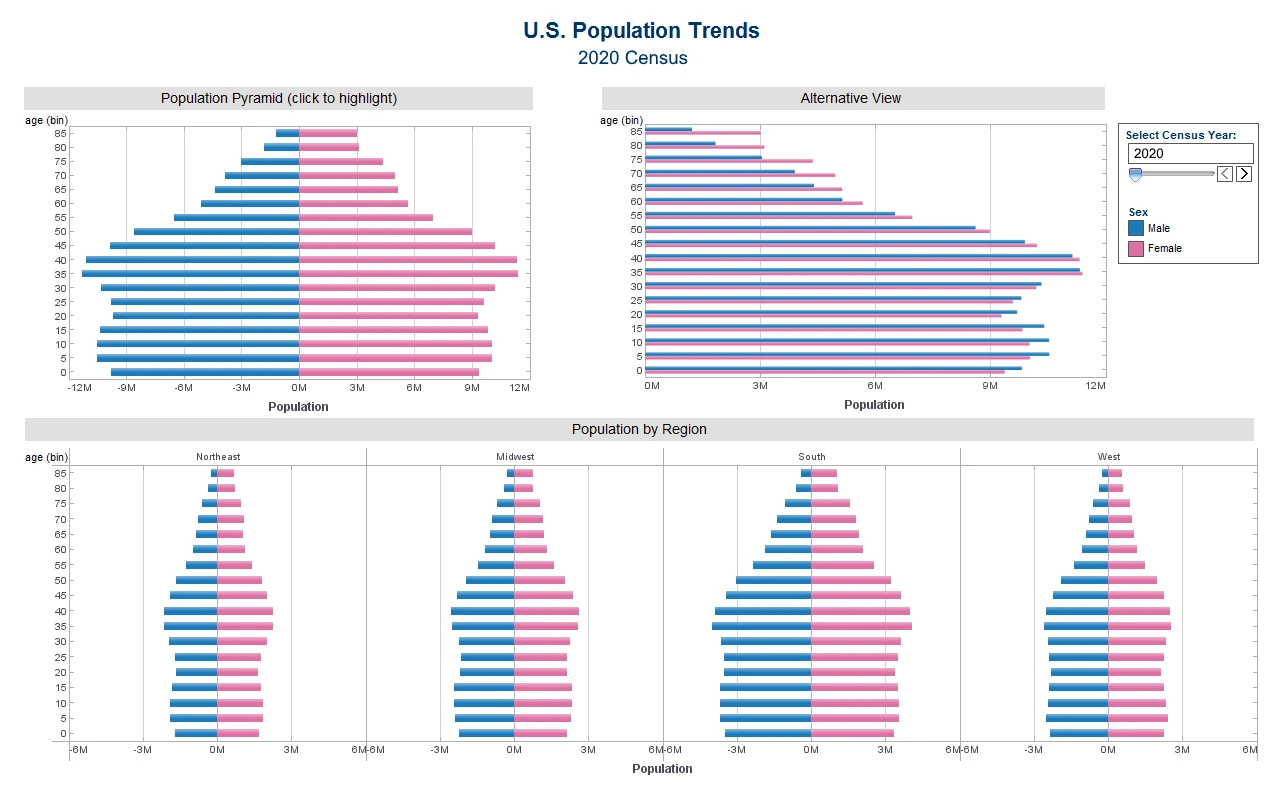
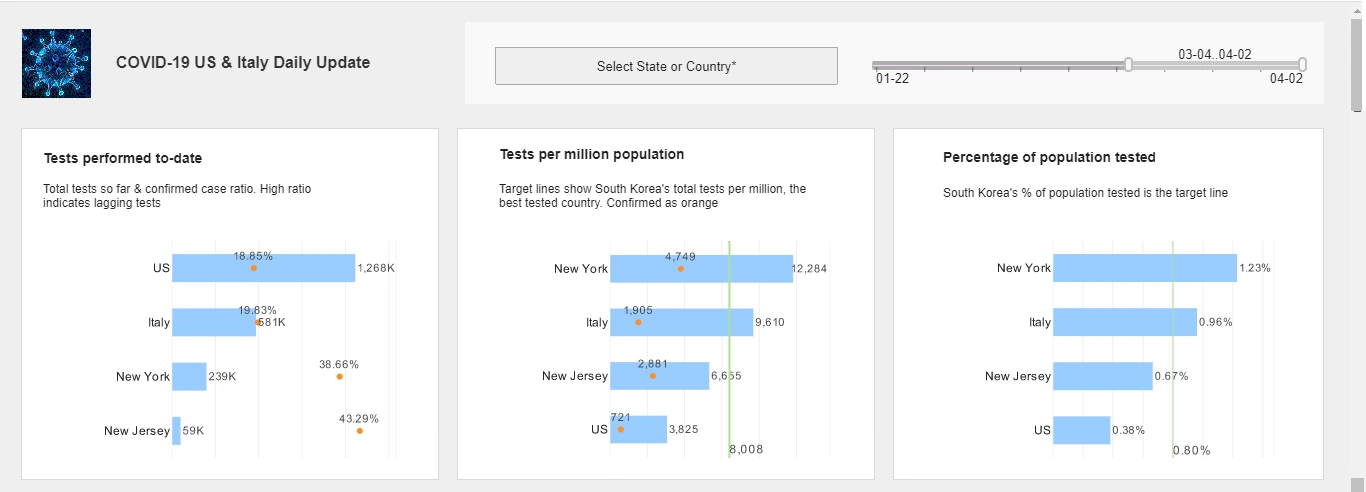
Style Report also includes a charting library with over 30 different chart types, to present organizational data in an intuitively visual way.
All new clients and partners get free one-on-one business intelligence expert help to accelerate deployment.


InetSoft Offers Data Mashup for Robust, Agile Reporting
With InetSoft's robust data mashup engine, reports can be created with data pulled from many disparate sources in real time. Information that would have been previously presented in multiple reports can now be consolidated into one.
Data sources that can be accessed include relational databases (JDBC), multidimensional databases, XML, SOAP, Java beans (POJO), Microsoft Excel, flat files, and much more.
InetSoft's solution also features a data grid cache, which automatically updates itself from data sources at a regularly scheduled time.
The report wizard also allows users to create their own ad hoc reports to answer specific needs, without help from IT.
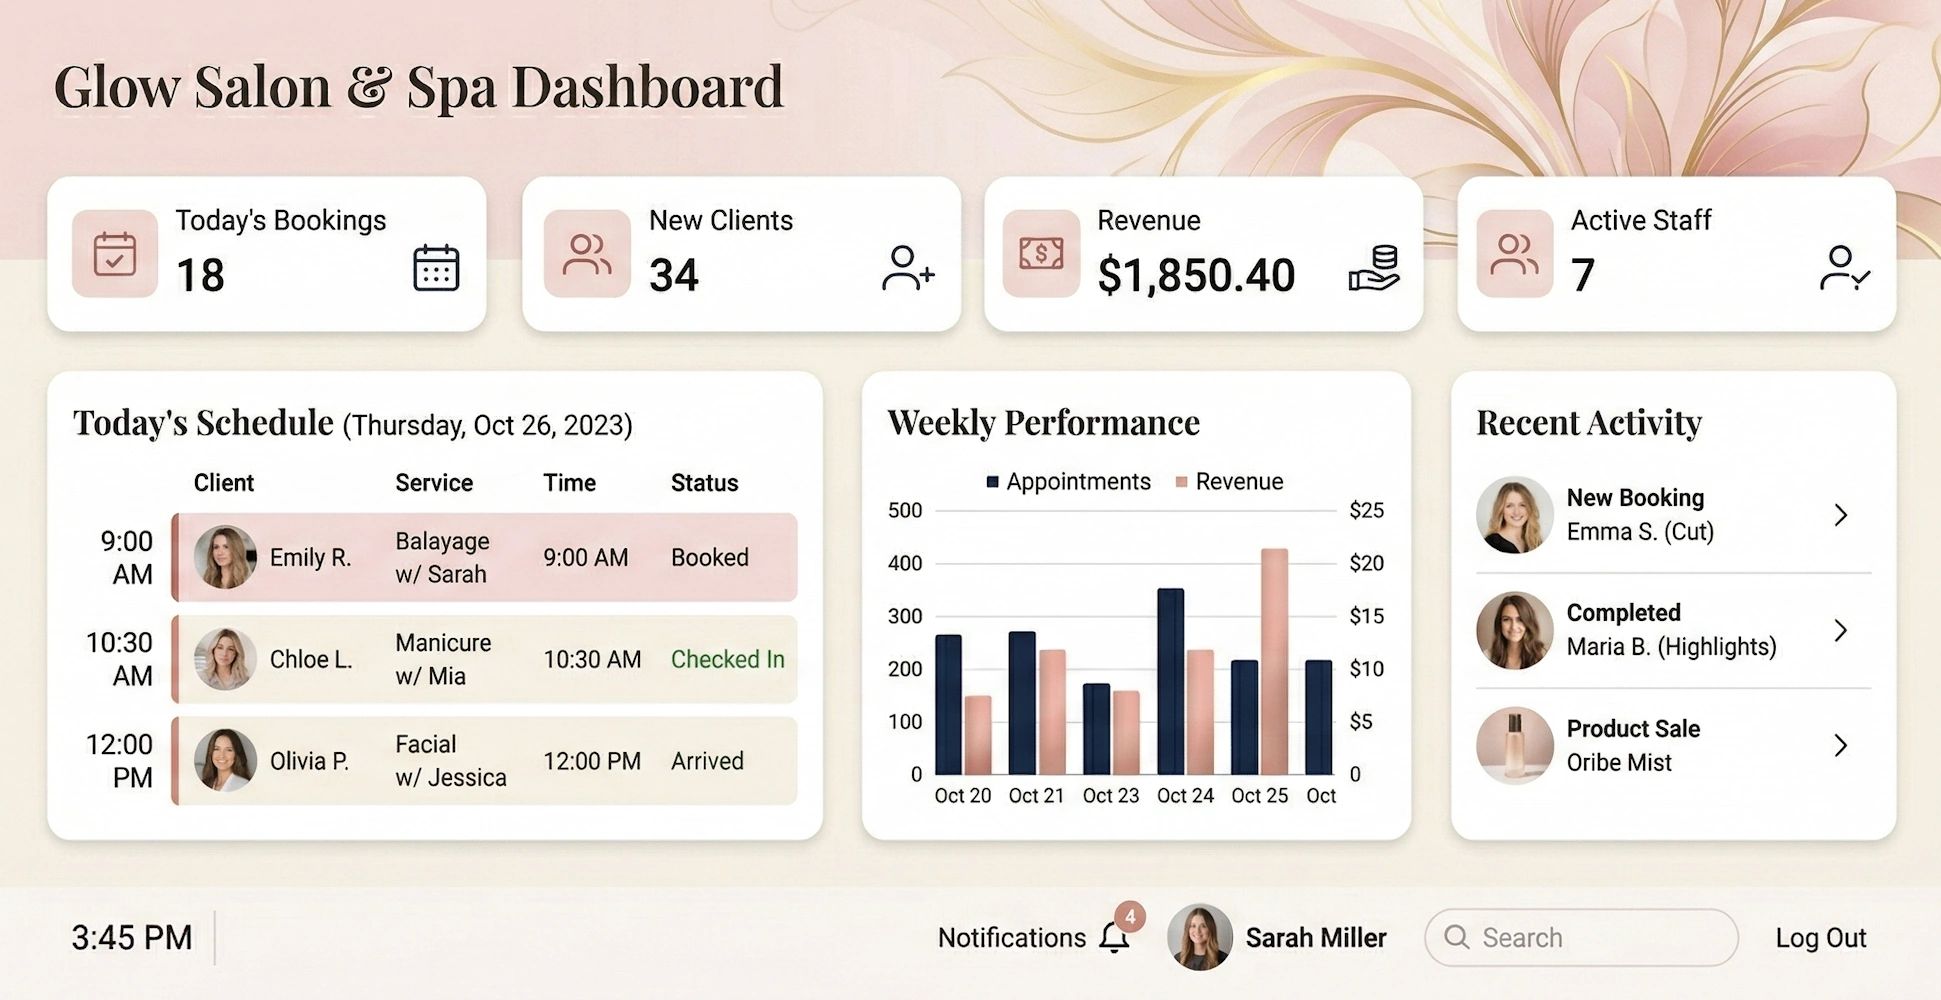
How Would a Beauty Salon Owner Use a Simple Reporting Tool?
A beauty salon owner can significantly benefit from beauty salon software by utilizing a simple reporting tool to streamline operations. This software allows owners to analyze appointment trends, track revenue, and manage inventory effectively. With insights into customer retention and feedback, beauty salon software also helps evaluate marketing success and monitor employee performance. By understanding expenses and customer demographics, salon owners can optimize services and improve profit margins, leading to informed decision-making and business growth.
-
Appointment Booking and Scheduling Analysis:
- Generate reports to analyze peak booking times, popular services, and stylist availability.
- Identify trends in appointment cancellations or no-shows to implement strategies for reducing them.
-
Revenue and Sales Performance:
- Track daily, weekly, and monthly revenue to identify trends and seasonality in sales.
- Monitor the performance of individual stylists and services to determine which are most profitable.
-
Inventory Management:
- Use reports to keep track of product sales, popular products, and inventory levels.
- Set up alerts for low-stock items to ensure popular products are always available to customers.
-
Customer Analytics:
- Track customer retention rates and identify which services or stylists are most popular among repeat customers.
- Monitor customer feedback and reviews to improve service quality and customer satisfaction.
-
Marketing and Promotion Effectiveness:
- Evaluate the success of marketing campaigns and promotions by tracking the number of new customers acquired and the revenue generated from specific promotions.
-
Employee Performance and Payroll:
- Generate reports on stylists' sales performance, client retention, and average transaction value.
- Use this data to set performance-based incentives or commissions.
-
Expense Tracking:
- Keep an eye on operational expenses such as rent, utilities, and supplies. Compare them to revenue to ensure profitability.
-
Customer Demographics:
- Analyze customer data to identify demographics, preferences, and purchasing behavior. This information can inform marketing strategies and service offerings.
-
Profit Margins:
- Calculate profit margins for different services and products to determine which offerings are most lucrative.
-
Appointment and Service Utilization:
- Track the utilization of appointment slots and service availability to optimize scheduling and minimize downtime.
-
Feedback and Reviews:
- Monitor customer feedback and reviews to identify areas for improvement and ensure high levels of customer satisfaction.

About InetSoft
InetSoft is a pioneer in delivering easy, agile, and robust business intelligence software that makes it possible for organizations and solution providers of all sizes to deploy or embed full-featured business intelligence solutions. Application highlights include visually-compelling and interactive dashboards that ensure greater end-user adoption plus pixel-perfect report generation, scheduling, and bursting.
InetSoft's patent pending Data Block™ technology enables productive reuse of queries and a unique capability for end-user defined data mashup. This capability combined with efficient information access enabled by InetSoft's visual analysis technologies allows maximum self-service that benefits the average business user, the IT administrator, and the developer. InetSoft solutions have been deployed at over 5,000 organizations worldwide, including 25% of Fortune 500 companies, spanning all types of industries.

More Resources for Seekers of Simple Reporting Tools
Collection of Departmental Business Intelligence Examples - Looking for departmental business intelligence examples? InetSoft's industry pioneering BI platform can support any department's dashboard needs. Interact with examples in the library, read articles about its capabilities below, and request a personalized demo. The Insurance Claims Dashboard example here demonstrates InetSoft's user-friendly analytical dashboards, perfect for organizations in need of a customizable and interactive software...
How a Free Visualization Tool Can Help - Visualization is the perfect technique for sifting through multi-dimensional data to spot trends and aberrations or slice and dice data with simple point-and-click methods. If you are looking for a way to visually explore and present data that standard office charting software cannot handle, and/or you're not able to install a desktop-based analytics application, Visualize Free is...

How to Make a Word Cloud Chart in InetSoft - Creating a Word Cloud with InetSoft software is extremely simple. A preliminary step is to transform a document or other word source into a table that contains the words and their relative frequencies, such as shown below...
Information About Tools of Business Intelligence - Below you may find useful resources about InetSoft's tools of business intelligence designed to be easy to use and easy to deploy BI tools by enterprises, ISV's, and SaaS providers: What are some more drivers of self-service BI? When it comes to business reporting requirements, most of the time business users spend a lot of time explaining what they need to do to the IT teams. After they get the report they spend more time realizing they needed to filter it a certain way, and have to go...
Resources About Reporting Technology - Researching reporting technology options for your application? InetSoft has been an innovator in offer flexible, powerful and easy to use reporting tools for enterprises and OEMs. Now its award winning reporting tools include pricing options comparable to open source vendors. InetSoft's reporting-only product is Style Report Enterprise. If you also want interactive...
Statistics And Model Development - Leverage the latest cloud technologies, existing and immerging statistical and machine learning techniques to identify data patterns and trends to solve business problems With support from more senior data and decision scientists, build and deploy customer segments to facilitate optimal marketing targeting within channels...