InetSoft's Product How-To: Create a Web Chart
Create a chart with InetSoft's free or commercial Web charting tools. View a demo and try them for free.
Style Intelligence is a commercial business intelligence software package with Web-based chart generation, reporting, and real-time access to almost any data source.
GTexture
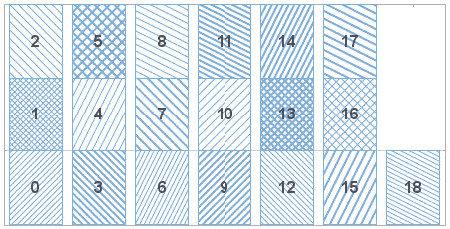
The GTexture object contains a set of patterns. Create a GTexture object by referring to a pattern number, 1–19.
var texture = GTexture.PATTERN_5;
The image below presents the available textures and their corresponding numbers.

 |
View a 2-minute demonstration of InetSoft's easy, agile, and robust BI software. |
GLine
The GLine object provides the following predefined line style constants:
GLine.THIN_LINE
GLine.DOT_LINE
GLine.DASH_LINE
GLine.MEDIUM_DASH
GLine.LARGE_DASH
You can also create a GLine object by passing a Chart constant (see Line Styles) to the object constructor, as follows:
var line = new GLine(Chart.DOT_LINE);
To create a user-defined style, pass a dash size and width (both type doubles) to the object constructor, as follows.
var line = new GLine(dashsize, width);
Example (Report)
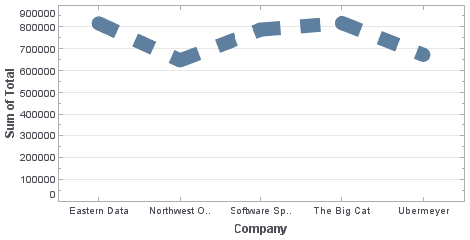
Bind a line-type chart to the sample 'All Sales' query, with 'Company' (top 5) on the X-axis, and Sum(Total) on the Y-axis. Add the following script in the onLoad Handler.
importPackage(inetsoft.graph.aesthetic);

Graph1.bindingInfo.setShapeField("Company",Chart.NUMBER)

Graph1.bindingInfo.lineFrame = new StaticLineFrame;

Graph1.bindingInfo.lineFrame.line = GLine(20,10);
GShape
The GShape object contains a set of shapes. For element properties requiring a GShape object, the shape can be specified as shown below.
GShape.ImageShape        (user-defined image)
GShape.ARROW
GShape.ARROWBAR
GShape.CIRCLE
GShape.CROSS
GShape.DIAMOND
GShape.FILLED_ARROW
GShape.FILLED_ARROWBAR
GShape.FILLED_CIRCLE
GShape.FILLED_DIAMOND
GShape.FILLED_SQUARE
GShape.FILLED_TRIANGLE
GShape.HYPHEN
GShape.LINE
GShape.LSHAPE
GShape.SQUARE
GShape.STAR
GShape.STICK
GShape.TRIANGLE
GShape.VSHAPE
GShape.XSHAPE
 |
View live interactive examples in InetSoft's dashboard and visualization gallery. |
GShape.ImageShape
The GShape.ImageShape object contains a custom image to be used as a fill pattern with StaticShapeFrame and CategoricalShapeFrame objects. To create an ImageShape object, call the object constructor:
var shape = new GShape.ImageShape("http://.../image.gif");
You can provide the image location as input to the constructor, e.g.,
var shape = new GShape.ImageShape("http://.../image.gif");
or specify this later using the GShape.ImageShape.image property.
Example (Report)
Bind a point-type chart to the sample 'All Sales' query, with 'Company' (top 5) on the X-axis, and Sum(Total) on the Y-axis. Add the following script in the onLoad Handler.
importPackage(inetsoft.graph.aesthetic);
Graph1.bindingInfo.setShapeField('Employee',Chart.STRING)
var logo =
  getImage("http://www.inetsoft.com/images/home/logo.gif");
var shape = new GShape.ImageShape();
shape.image = logo;
var frame = new StaticShapeFrame(shape);
Graph1.bindingInfo.shapeFrame = frame;
Example (Report or Viewsheet)
importPackage(inetsoft.graph)
importPackage(inetsoft.graph.element)
importPackage(inetsoft.graph.scale)
importPackage(inetsoft.graph.aesthetic)
importPackage(inetsoft.graph.data)

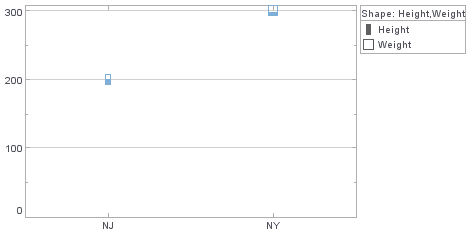
var arr = [["State","Quantity"], ["NJ",200], ["NY",300]];
dataset = new DefaultDataSet(arr);
graph = new EGraph();
var elem = new IntervalElement("State", "Quantity");
var logo =
  getImage("http://www.inetsoft.com/images/home/logo.gif");
var shape = new GShape.ImageShape();
shape.image = logo;
var frame = new StaticShapeFrame(shape)
elem.setShapeFrame(frame);
graph.addElement(elem);
Example (Report or Viewsheet)
importPackage(inetsoft.graph)
importPackage(inetsoft.graph.element)
importPackage(inetsoft.graph.scale)
importPackage(inetsoft.graph.aesthetic)
importPackage(inetsoft.graph.data)

var arr = [["State", "Quantity"], ["NJ", 200], ["NY", 300]];
dataset = new DefaultDataSet(arr);
graph = new EGraph();
var elem = new IntervalElement("State", "Quantity");
var logo =
  getImage("http://www.inetsoft.com/images/home/logo.gif");
var shape = new GShape.ImageShape(logo);
var frame = new CategoricalShapeFrame("State");
frame.setShape("NJ", shape);
elem.setShapeFrame(frame);
graph.addElement(elem);
GShape.ImageShape.image
Specifies the image to use as the fill.
Type
Image object, see getImage()
Example (Report)
Bind a point-type chart to the sample 'All Sales' query, with 'Company' (top 5) on the X-axis, and Sum(Total) on the Y-axis. Add the following script in the onLoad Handler.
importPackage(inetsoft.graph.aesthetic);
Graph1.bindingInfo.setShapeField("Employee",Chart.STRING);
var logo =
  getImage("http://www.inetsoft.com/images/home/logo.gif");
var shape = new GShape.ImageShape();
shape.image = logo;
var frame = new StaticShapeFrame(shape);
Graph1.bindingInfo.shapeFrame = frame;

importPackage(inetsoft.graph)
importPackage(inetsoft.graph.element)
importPackage(inetsoft.graph.scale)
importPackage(inetsoft.graph.aesthetic)
importPackage(inetsoft.graph.data)

var arr = [["State", "Quantity"], ["NJ", 200], ["NY", 300]];
dataset = new DefaultDataSet(arr);
graph = new EGraph();
var elem = new IntervalElement("State", "Quantity");
var logo =
  getImage("http://www.inetsoft.com/images/home/logo.gif");
var shape = new GShape.ImageShape();
shape.setImage(logo);
var frame = new StaticShapeFrame(shape)
elem.setShapeFrame(frame);
graph.addElement(elem);
 |
Read the top 10 reasons for selecting InetSoft as your BI partner. |
GShape.ImageShape.tile
Specifies whether the image should be stretched to fit the fill area or tiled at the original size.
Type
 Boolean        true: keep original size, and tile to fit
                false: stretch to fit (default)
Example (Report)
Bind a point-type chart to the sample 'All Sales' query, with 'Company' (top 5) on the X-axis, and Sum(Total) on the Y-axis. Add the following script in the onLoad Handler.
importPackage(inetsoft.graph.aesthetic);
Graph1.bindingInfo.setShapeField("Employee",Chart.STRING);
var logo =
  getImage("http://www.inetsoft.com/images/home/logo.gif");
var shape = new GShape.ImageShape();
shape.image = logo;
shape.tile = true;
var frame = new StaticShapeFrame(shape);
Graph1.bindingInfo.shapeFrame = frame;
Example (Report or Viewsheet)
importPackage(inetsoft.graph)
importPackage(inetsoft.graph.element)
importPackage(inetsoft.graph.scale)
importPackage(inetsoft.graph.aesthetic)
importPackage(inetsoft.graph.data)

var arr = [["State", "Quantity"], ["NJ", 200], ["NY", 300]];
dataset = new DefaultDataSet(arr);
graph = new EGraph();
var elem = new IntervalElement("State", "Quantity");
var logo =
  getImage("http://www.inetsoft.com/images/home/logo.gif");
var shape = new GShape.ImageShape();
shape.setImage(logo);
shape.setTile(true);
var frame = new StaticShapeFrame(shape)
elem.setShapeFrame(frame);
graph.addElement(elem);
| Previous: Web Chart Generator |
Next: Chart Styles
|

