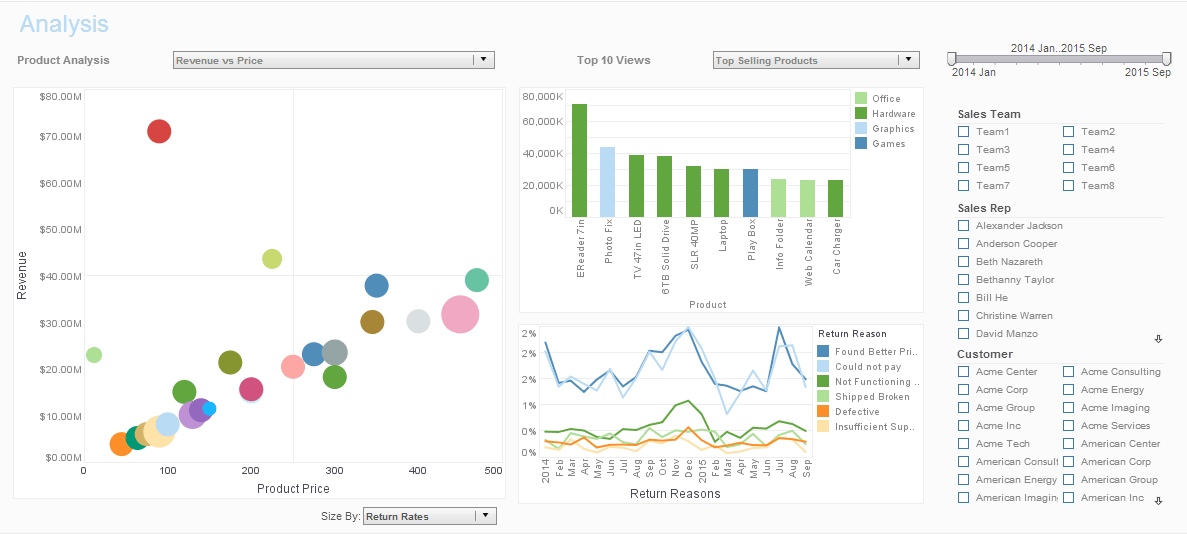
InetSoft Product How-To: Create and Embed Dynamic Charts
Consider using InetSoft to create and embed dynamic charts into your Web site or application. InetSoft offers both free and commercial software for making charts. View a demo and try our chart tools for free.
Style Intelligence is a commercial business intelligence software package with dashboarding, reporting, and real-time access to almost any data source.
 |
View a 2-minute demonstration of InetSoft's easy, agile, and robust BI software. |
OvalShapeFrame.setFill(value) / OvalShapeFrame.fill
Specifies the fill for the oval elements.
Parameter/Type
 Boolean
 true: fill oval
 false: do not fill oval
Example (Report)
Bind a point-type chart to the sample 'All Sales' query, with 'Company' (top 5) on the X-axis, and Sum(Total) on the Y-axis. Add the following script in the onLoad Handler.
importPackage(inetsoft.graph.aesthetic);
Graph1.bindingInfo.setShapeField("Total",Chart.NUMBER);
Graph1.bindingInfo.shapeFrame = new OvalShapeFrame;
Graph1.bindingInfo.shapeFrame.fill = true;
Example (Report or Viewsheet)
importPackage(inetsoft.graph)
importPackage(inetsoft.graph.element)
importPackage(inetsoft.graph.scale)
importPackage(inetsoft.graph.aesthetic)
importPackage(inetsoft.graph.data)

var arr = [["State","Quantity","Total"], ["NJ",200,30],
           ["NY",300,15],["PA",150,5]];
dataset = new DefaultDataSet(arr);
graph = new EGraph();
var elem = new IntervalElement("State", "Quantity");
var frame = new OvalShapeFrame("Total");
frame.setFill(true);
elem.setShapeFrame(frame);
graph.addElement(elem);
FillShapeFrame
The FillShapeFrame object contains the shape styles for oval elements with variable degree of fill. To create a FillShapeFrame object, call the FillShapeFrame constructor.
importPackage(inetsoft.graph.aesthetic);

var frame = new FillShapeFrame('Total');
You can pass the name of a field (e.g., 'Total') to the constructor, or specify this later using the inherited VisualFrame.setField(field) property.
Example (Report)
Bind a point-type chart to the sample 'All Sales' query, with 'Company' (top 5) on the X-axis, and Sum(Total) on the Y-axis. Add the following script in the onLoad Handler.
importPackage(inetsoft.graph.aesthetic);

Graph1.bindingInfo.setShapeField("Total",Chart.NUMBER);

Graph1.bindingInfo.shapeFrame = new FillShapeFrame;
Example (Report or Viewsheet)
importPackage(inetsoft.graph)
importPackage(inetsoft.graph.element)
importPackage(inetsoft.graph.scale)
importPackage(inetsoft.graph.aesthetic)
importPackage(inetsoft.graph.data)

var arr = [["State","Quantity","Total"], ["NJ",200,30],
           ["NY",300,15],["PA",150,5]];
dataset = new DefaultDataSet(arr);
graph = new EGraph();
var elem = new PointElement("State", "Quantity");
var shapeframe = new FillShapeFrame("Total");
var sizeframe = new StaticSizeFrame();
sizeframe.setSize(10);
elem.setSizeFrame(sizeframe);
elem.setShapeFrame(shapeframe);
graph.addElement(elem);
OrientationShapeFrame
The OrientationShapeFrame object contains the shape styles for line elements with variable orientation. To create a OrientationShapeFrame object, call the OrientationShapeFrame constructor.
 importPackage(inetsoft.graph.aesthetic);
 var frame = new OrientationShapeFrame('Total');
You can pass the name of a field (e.g., 'Total') to the constructor, or specify this later using the inherited VisualFrame.setField(field) property.
Example (Report)
Bind a point-type chart to the sample 'All Sales' query, with 'Company' (top 5) on the X-axis, and Sum(Total) on the Y-axis. Add the following script in the onLoad Handler.
importPackage(inetsoft.graph.aesthetic);
Graph1.bindingInfo.setShapeField("Total",Chart.NUMBER);
Graph1.bindingInfo.shapeFrame = new OrientationShapeFrame;
Example (Report or Viewsheet)
importPackage(inetsoft.graph)
importPackage(inetsoft.graph.element)
importPackage(inetsoft.graph.scale)
importPackage(inetsoft.graph.aesthetic)
importPackage(inetsoft.graph.data)

var arr = [["State","Quantity","Total"], ["NJ",200,30],
           ["NY",300,15],["PA",150,5]];
dataset = new DefaultDataSet(arr);
graph = new EGraph();
var elem = new PointElement("State", "Quantity");
var shapeframe = new OrientationShapeFrame("Total");
var sizeframe = new StaticSizeFrame();
sizeframe.setSize(10);
elem.setSizeFrame(sizeframe);
elem.setShapeFrame(shapeframe);
graph.addElement(elem);
PolygonShapeFrame
The PolygonShapeFrame object contains the shape styles for elements with varying number of sides. To create a PolygonShapeFrame object, call the PolygonShapeFrame constructor.
importPackage(inetsoft.graph.aesthetic);

var frame = new PolygonShapeFrame('Total');
You can pass the name of a field (e.g., 'Total') to the constructor, or specify this later using the inherited VisualFrame.setField(field) property.
Example (Report)
Bind a point-type chart to the sample 'All Sales' query, with 'Company' (top 5) on the X-axis, and Sum(Total) on the Y-axis. Add the following script in the onLoad Handler.
importPackage(inetsoft.graph.aesthetic);
Graph1.bindingInfo.setShapeField("Total",Chart.NUMBER);
Graph1.bindingInfo.shapeFrame = new PolygonShapeFrame;
Example (Report or Viewsheet)
importPackage(inetsoft.graph)
importPackage(inetsoft.graph.element)
importPackage(inetsoft.graph.scale)
importPackage(inetsoft.graph.aesthetic)
importPackage(inetsoft.graph.data)

var arr = [["State","Quantity","Total"], ["NJ",200,30],
           ["NY",300,15],["PA",150,5]];
dataset = new DefaultDataSet(arr);
graph = new EGraph();
var elem = new PointElement("State", "Quantity");
var sizeframe = new StaticSizeFrame();
sizeframe.setSize(10);
var frame = new PolygonShapeFrame("Total");
elem.setShapeFrame(frame);
elem.setSizeFrame(sizeframe);
graph.addElement(elem);
PolygonShapeFrame.setfill(Boolean) / PolygonShapeFrame.fill
Specifies whether the polygonal elements should be filled.
Parameter/Type
Boolean true: fill oval

false: do not fill oval
Example (Report)
Bind a point-type chart to the sample 'All Sales' query, with 'Company' (top 5) on the X-axis, and Sum(Total) on the Y-axis. Add the following script in the onLoad Handler.
importPackage(inetsoft.graph.aesthetic);
Graph1.bindingInfo.setShapeField("Total",Chart.NUMBER);
Graph1.bindingInfo.shapeFrame = new PolygonShapeFrame;
Graph1.bindingInfo.shapeFrame.fill = true;
Example (Report or Viewsheet)
importPackage(inetsoft.graph)
importPackage(inetsoft.graph.element)
importPackage(inetsoft.graph.scale)
importPackage(inetsoft.graph.aesthetic)
importPackage(inetsoft.graph.data)

var arr = [["State","Quantity","Total"], ["NJ",200,30],
           ["NY",300,15],["PA",150,5]];
dataset = new DefaultDataSet(arr);
graph = new EGraph();
var elem = new PointElement("State", "Quantity");
var sizeframe = new StaticSizeFrame();
sizeframe.setSize(10);
var frame = new PolygonShapeFrame("Total");
frame.setFill(true);
elem.setShapeFrame(frame);
elem.setSizeFrame(sizeframe);
graph.addElement(elem);
 |
Read why choosing InetSoft's cloud-flexible BI provides advantages over other BI options. |
