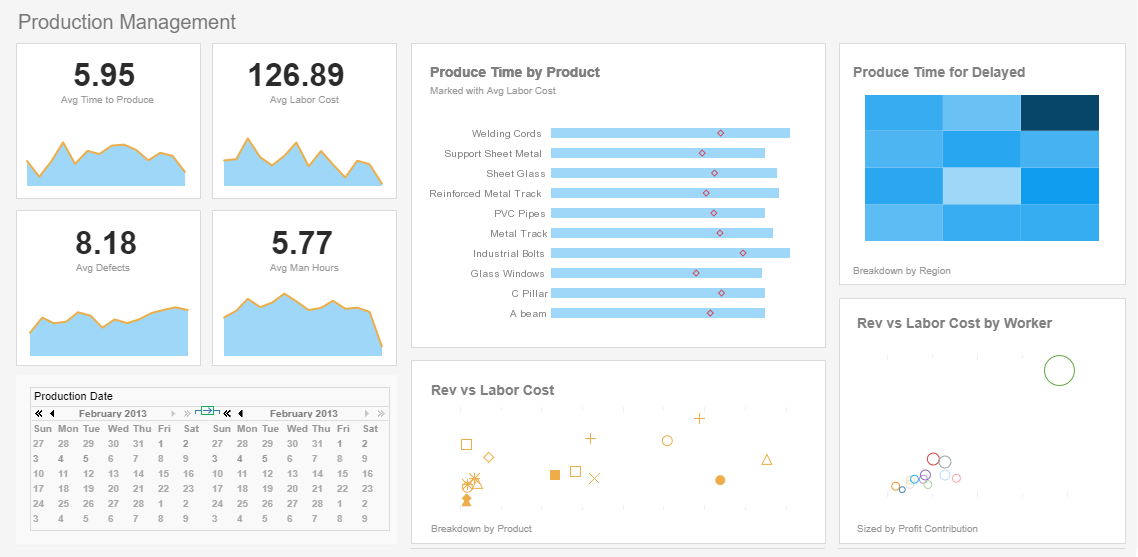
Mixed Dashboard Data Solution
InetSoft's business intelligence and analytics tools provide users with the power to access mixed sources of data at the same time. View the example below to learn more about the Style Intelligence solution.
| #1 Ranking: Read how InetSoft was rated #1 for user adoption in G2's user survey-based index | Read More |
The following expressions allow you to access any cell in a table by absolute reference.
table[rowIx][colIx]data[rowIx][colIx]
Simply set the rowIx and colIx indexes to specify the position of the desired cell. For example:
• table[0][0]: Value in first row, first column.
• table[2][4]: Value in third row, fifth column.You can type these keywords manually into your script, or you can click the appropriate node on the 'Component' tree in the Script Editor.
 |
View live interactive examples in InetSoft's dashboard and visualization gallery. |
You can use absolute and relative references in the same statement, as the following example illustrates. It will set the header cell of the 'Price' column to show a red background if there exists a price exceeding $2000, and will otherwise show a green background. This requires a loop structure, as well as mixed absolute and relative references:
1. Select the header cell in the 'Price' column. Right-click and choose 'Format'.
2. Select the Color tab. From the 'Fill Color' menu select the 'Expression' option, and click the 'Edit' button. This opens the Formula Editor.
3. Add the following script in the Formula Editor: for (i=1; i 2000) { [255,0,0]; break;} else [0,255,0]; }
4. Click 'OK' to exit the Formula Editor, and then click 'OK' to exit the 'Format' dialog box. The header cell is read because a price exists that exceeds $2000. To test the header cell script, add a Range Slider to filter the values in the table. Follow these steps:
5. Drag a Range Slider from the Component tree into the Viewsheet. This creates a new Range Slider.
6. From the 'ProductInfo' Data Block in the Component tree, drag the 'Price' field onto the Range Slider. This binds the Range Slider to the 'Price' field.
7. Drag the right side of the Range Slider to vary the prices included in the dataset. Observe the color of the header cell as the dataset changes.
More Articles About Dashboarding
Collection of Interactive Visualization Dashboard Examples - Data dashboards allow you to quickly view KPIs for different departments within your organization. They're also useful when you need to compare how well each department is performing against its goals. Click on an image to open one of these live interactive dashboards in a new tab. These industry specific visualization dashboards allow you to get a feel for how easy it to use InetSoft's data dashboard software...
Improvement in Seeing KPIs - But to see such a significant improvement in that KPI by itself has just been amazing for us to see. It's a great deal of improvement in such a short time. We've been talking about working capital for a long time, and we've got dozens of reports that explain working capital and which partners are responsible for which part of it. And I've just been stunned to be sitting in a room with the partner's looking at the numbers and pointing at it, and saying oh, how it can be like that...
BI Professionals Supporting Others - So, you have to be able to surface constraints and show them to people. Now, the report shows the data well, but it typically does not show the constraints that we're applying to retrieve that data. This often leads in the BI world to problem solving for us as the BI professionals supporting others. These aren't the constraints you're looking for. You have the report using these constraints, but you left out some data. That's why your numbers don't match...
Role of a Mining Production Analyst - It's important to understand what a mining production analyst is responsible for before getting into the details. These experts are in charge of compiling, deciphering, and interpreting enormous volumes of data pertaining to mining operations. Their main objective is to support data-driven decision-making and provide insights to improve operational performance, resource allocation, and production processes...
Six Phases of Data Analytics - Data analytics is the process of looking at and analyzing data to draw conclusions and make wise judgments. In order to gather, process, and analyze data from diverse sources, including databases, spreadsheets, and internet platforms, a range of approaches and technologies are used. To make data-driven decisions and optimize operations, data analytics is employed in a range of industries, including business, finance, healthcare, and government...
Tool to Make Wind Rose Charts Online for Free - To easily and quickly create Wind Rose Charts online for free, create a Free Individual Account on the InetSoft website. You will then be able to upload a text data set, as shown below: choosing dashboard source Once you have done that, you will be able to proceed to the Visualization Recommender, which will get you started creating a dashboard. To start with a wind rose plot, though, you can skip the Recommender by pressing the Finish button at the top bar of the Recommender. Then press Continue to go to Visual Composer. Proceed to add a Chart component using Visual Composer, and follow the steps shown earlier to create the desired wind rose...
| Previous: Disparate Dashboard Data |
Next: Accessing Dashboard Data
|


