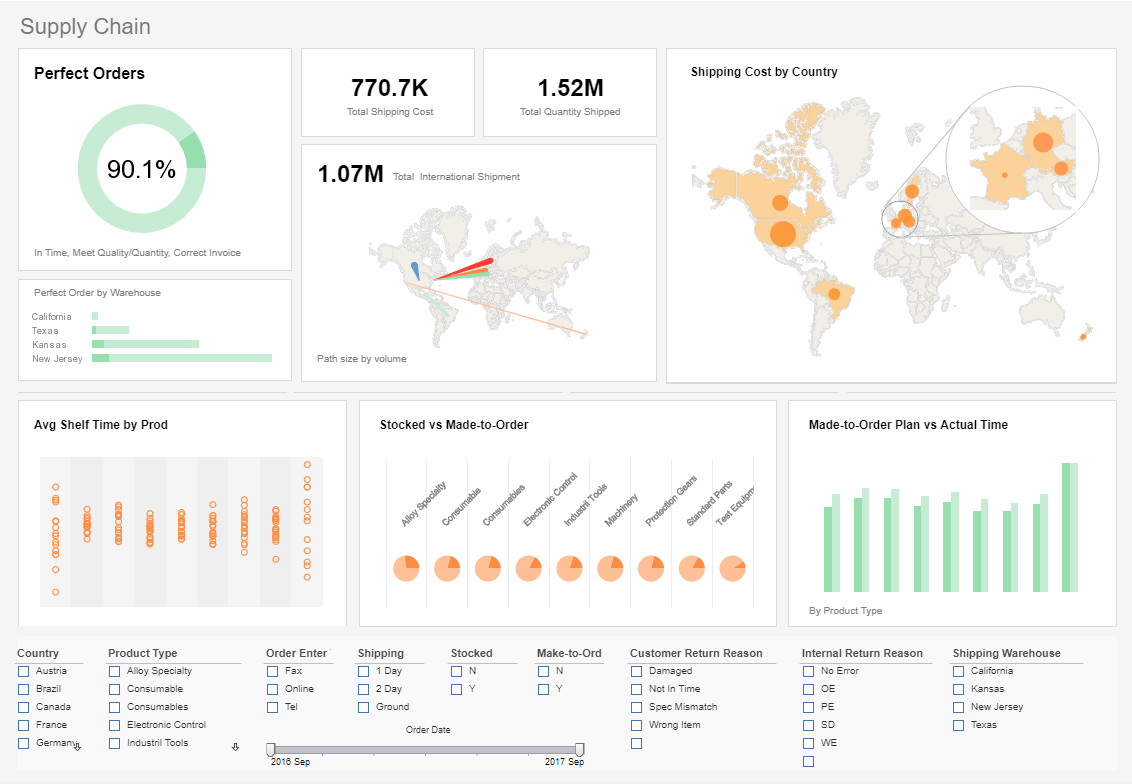
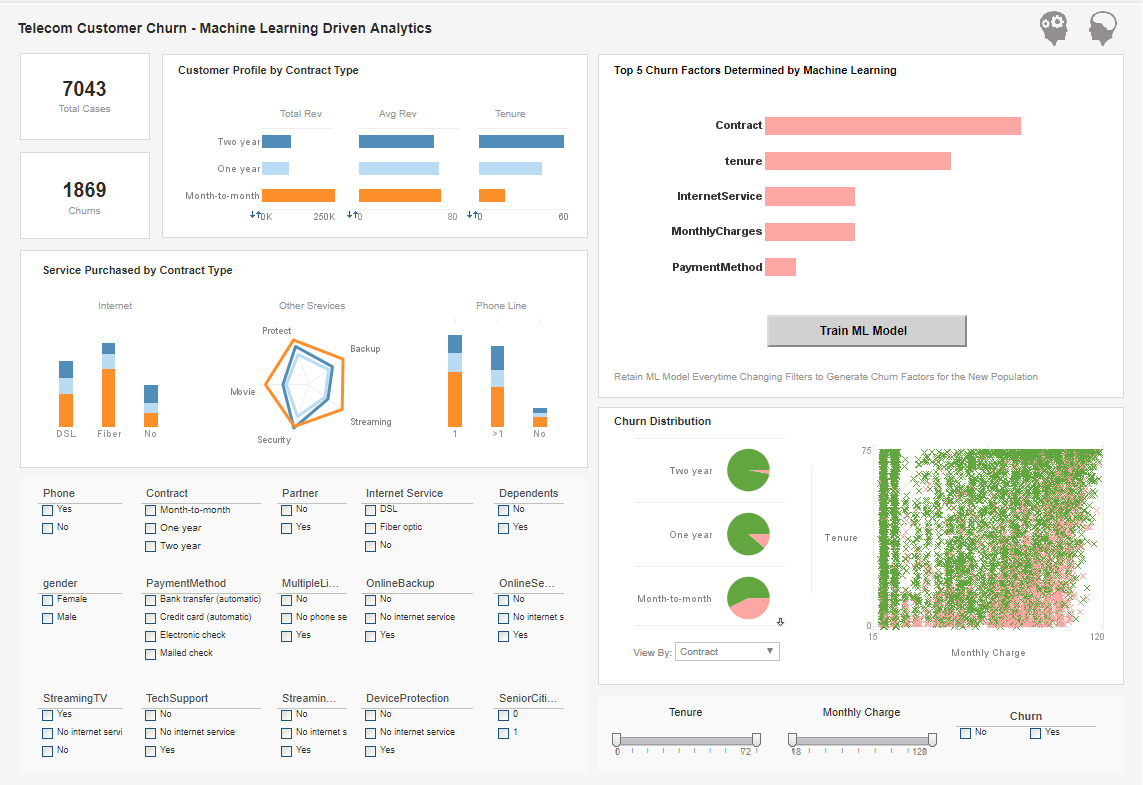
Below are some examples of interactive charts generated by InetSoft's charting engine. And following is documentation on using InetSoft's JavaScript-like API for programmatically generating charts. Alternatively use InetSoft's drag-and-drop chart designer.

Documentation
onLoad Handler
The onLoad handler is similar to the onInit handler, and is also executed at the beginning of report generation. It differs from onInit in two important ways:
- onLoad script is executed every time a report is processed.
- onLoad script is executed after report parameter prompting.
- Declaring report-level variables. For example, to keep a subtotal on each page, declare the 'subtotal' variable in the onLoad script and then update it using onPageBreak Handler script.
- Initializing the report based on user input parameters. For example, onLoad script can set chart styles, report headers, element visibility, etc. The onLoad handler has access to the 'parameter' array that contains all report parameter values. For example, to hide a chart if a parameter is false:
The typical usages of the onLoad handler are the following:
if(!parameter['showChart']) { Chart1.visible = false; }
| #1 Ranking: Read how InetSoft was rated #1 for user adoption in G2's user survey-based index | Read More |
onPageBreak Handler
The onPageBreak handler is executed at the end of every page, after all elements on the page have been processed (except for headers and footers). Because the onPageBreak handler follows body-element processing, it should not modify the body contents on the current page. It can, however, modify contents in the header and footer of the current page.
The main use of onPageBreak is to calculate page-level summarization. It is also useful in cases where you wish to display page numbering in the body of the report. You can use the onPageBreak handler to increment a “page number” variable, and then reference that variable in the desired elements.
 |
View a 2-minute demonstration of InetSoft's easy, agile, and robust BI software. |
The OnPageBreak Event Handler
A special variable, 'event', is available in the onPageBreak handler. This object contains information about what is on the current page. It has the following properties:
Table 3. OnPageBreak Event Handler Properties
|
Property |
Description |
|
elementID |
The ID of the last element on the current page. |
|
region |
A rectangle containing the last table region on the page: region.x is the left-most column number, region.y is the top row number, region.width is the number of columns, region.height is the number of rows. This property is only defined if the last element on the page is a table element. |
|
firstElementID |
The ID of the first element on the current page. |
|
firstRegion |
A rectangle containing the first table region on the page. This property is only defined if the first element is a table element. |
|
lastPage |
True if this is the last page of the report. |
|
rewound |
True if the last band on the page has been rewound. |
|
pageIndex |
The current page index (first page = 0) |
More Articles About Reporting
Example of Student Major Analysis - The Student Major Analysis Example is an interactive dashboard detailing the majors of college students in a 16 year time span utilizing InetSoft's cutting-edge business intelligence software. Focusing on numerous majors from different years, this dashboard clearly portrays the statistics with a visually pleasing chart along with a detailed data sheet showing the information with text. Furthermore, along with other data sets, the specific chart below allows users to filter by different majors. This helps improve the analyzation process when digging for specific information. More importantly, InetSoft's solution is easy to use and navigate so that organization members can all have access to the tools and capabilities as well...
KPIs for Security Intelligence Analysts - KPIs are quantifiable metrics that demonstrate how well a company is reaching its objectives. KPIs may assist security teams in evaluating the success of their security strategy and pinpointing opportunities for development in the context of security intelligence analysis. The KPIs that security intelligence analysts use include some of the following: Threat Intelligence Accuracy The accuracy of their threat intelligence is one of the major KPIs for security intelligence analysts. This entails calculating the proportion of notifications that are reliable and suitable for action. High levels of precision show that the team is successfully identifying and addressing serious dangers. On the other side, low accuracy levels can mean that the team is spending time and money looking for false positives...
Metrics of Performance in Different Industries - As shown in the previous examples given, different types of companies and departments track different kinds of metrics. This next section details the key metrics for various departments and industries. Sales Metrics Sales teams, rely on data to make decisions and form strategies just as marketing teams do. Metrics cover the monitoring of the sales pipeline, and comparing sales to qualified leads...
This Year's Top 10 Dashboard Tools - At InetSoft, we simplify the problem for you, plus more. Since 1996, InetSoft has been transcending BI solutions for organizations of all sizes. By carefully considering a business user's point of view, we incorporate tools that only help maximize your organization's effectiveness. What makes InetSoft's dashboard tool so intuitive and powerful is the multitude of features and options, easy-to-use interface, and integration with some of our other products like reporting tools, analytics software, and access to almost any data source...
| Previous: Setting the onClick Range |

