Portlet Dashboards
The following sections introduce you to the monitoring capabilities available in Style Intelligence, Portlet Dashboards and Scorecards.
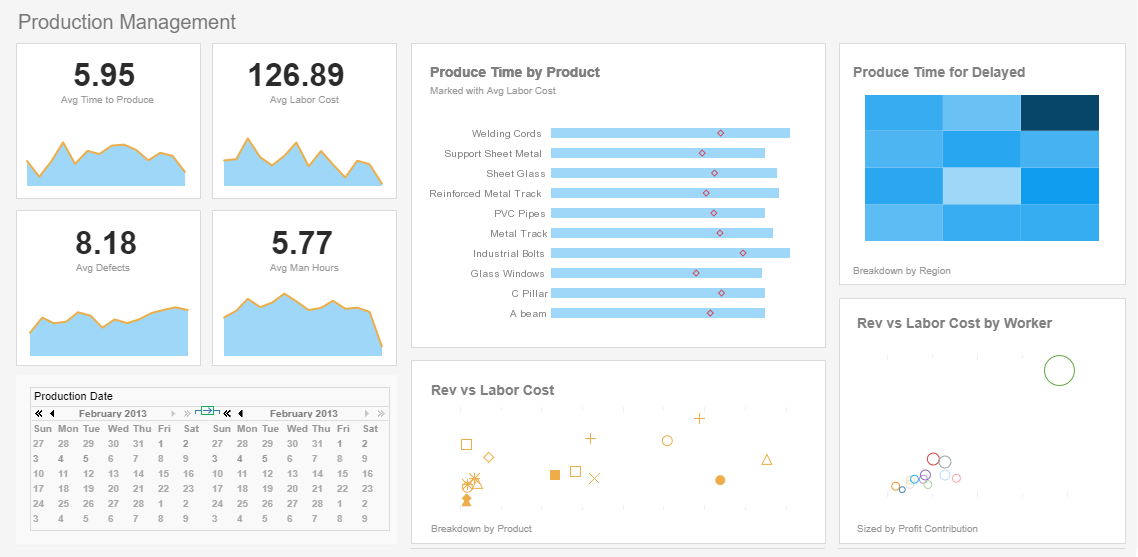
A portlet dashboard is a visual monitoring tool that presents a cluster of display components on a single screen. These components are typically used to display Key Performance Indicators (KPIs) that provide rapid comprehension of business activities.
Style Intelligence gives you the ability to configure and set up your own portlet dashboards and subscribe to existing dashboards. The next sections explain how to do this.
Portlet dashboards are different than the Viewsheet dashboards described in Visual Exploration. Portlet dashboards are oriented toward monitoring and tracking, while Viewsheet dashboards are oriented toward exploration and knowledge discovery.
Configuring a Portlet Dashboard
When you log in to the Report Portal for the first time, you will see a set of default dashboards. For example, to see the dashboard below, follow these steps:
- Launch the User Portal from the Windows 'Start' menu: Start → All Programs → Style Intelligence → Style Intelligence Server. This opens the browser to the InetSoft Home page.
- Select the 'User Portal' link to open the Portal. This opens the Portal to the main Dashboard tab.
- Click the Portlet tab at the bottom of the screen.
A portlet dashboard layout consists of row containers, column containers, and portlets. Row containers are containers that lay out their child components from left to right. Column containers are containers that lay out their child components from top to bottom.
To create or edit portlet dashboards, click on the Design tab, and then click the 'Dashboard' link. Click 'New Dashboard' to start from scratch, or click the 'Edit' button to modify an existing dashboard. You can also edit a portlet dashboard by clicking the 'Edit Dashboard' link below the dashboard itself.
Why Would a Developer Use a Portlet Dashboard?
A developer might choose to use a portlet dashboard for several compelling reasons, each contributing to enhanced user experience, efficient development, and improved management of web applications. Portlet dashboards, often associated with portal frameworks like Java Portlet Specification (JSR 286) or other portal technologies, offer developers a versatile and modular approach to designing and organizing web applications. Here are key reasons why a developer would opt for a portlet dashboard:
- Modularity and Reusability:
- Portlet dashboards allow developers to create modular components (portlets) that can be independently developed, tested, and maintained.
- Developers can reuse existing portlets across multiple pages or applications, fostering a more efficient and scalable development process.
- Customization and Personalization:
- Portlets in a dashboard can be personalized and configured based on user preferences.
- Developers can create dashboards with configurable layouts, enabling users to arrange and prioritize content according to their specific needs and preferences.
- Centralized Information Hub:
- Portlet dashboards serve as centralized information hubs where users can access relevant data and functionality from various sources in a unified interface.
- Developers can aggregate data and services from disparate systems into a single dashboard, providing users with a comprehensive overview.
- Responsive Design:
- Portlet dashboards are designed to be responsive, adapting to different screen sizes and devices.
- Developers can ensure a consistent user experience across desktops, tablets, and mobile devices without the need for separate development efforts.
- Integration with Enterprise Systems:
- Portlet dashboards facilitate seamless integration with enterprise systems, databases, and external APIs.
- Developers can embed business intelligence, reporting tools, or other external services directly into the dashboard, enhancing data accessibility and decision-making.
- Streamlined Development Process:
- Portlet frameworks provide a structured development environment with predefined APIs and conventions.
- Developers can leverage these frameworks to streamline the development process, reducing the time and effort required to create feature-rich web applications.
- Role-Based Access Control:
- Portlet dashboards often support role-based access control, allowing developers to define permissions and restrict access to specific portlets based on user roles.
- This ensures that users only see the information and functionality relevant to their roles within the organization.
- Easy Maintenance and Updates:
- Portlet-based architectures make it easier to maintain and update web applications.
- Developers can modify or add new portlets without disrupting the entire application, making maintenance and updates more granular and manageable.
- Scalability:
- Portlet dashboards offer scalability, allowing developers to add or remove portlets as needed.
- This flexibility enables applications to evolve and scale with changing business requirements without significant redevelopment efforts.
- User Engagement and Productivity:
- Portlet dashboards contribute to improved user engagement by providing a user-friendly and intuitive interface.
- Developers can design dashboards that enhance user productivity by presenting key information and tools in a consolidated and easily accessible manner.


