Comparing InetSoft StyleBI with Tableau
Are you looking to see how InetSoft's solution stacks up against Tableau Software? Peer-to-peer business solutions review platform G2 Crowd has released its ratings of BI vendors and InetSoft has scored impressively, beating Tableau in the majority of ratings.
InetSoft beat Tableau in 6 out of 7 general categories: its capacity to Generally Meet Requirements, Ease of Use, Setup, and Administration, Quality of Support and Ease of Doing Business With. None of these ratings come as a surprise to anyone who's experienced InetSoft's versatility and commitment to its customer base.
InetSoft also outperformed Tableau on rankings related to the strength of its platform, winning in Sandbox/Test Environments, Customization, User, Role, and Access Management, and Breadth of Partner Applications. InetSoft's strength in customization ranges from its white label friendliness as an embeddeble OEM product to its flexibility in assigning permissions to various levels of users.


An Easy to Learn Alternative to Tableau
InetSoft's solution is known for being easy to deploy, so it's no surprise that InetSoft beat Tableau in Ease of Use, Setup, and Administration. The ease and flexibility of the InetSoft platform is often reflected in the relatively fast deployment time; InetSoft customers appreciate that the InetSoft platform can be deployed in a matter of hours, as opposed to deployments stretching on for weeks that are typical of other BI products.
Self service is a particular focus of InetSoft, and in that area InetSoft outranked Tableau in Calculated Fields, Data Column Filtering, Search, and Collaboration/Workflow. InetSoft's proprietary data worksheet makes data alterations, mashups, and reformatting easy to accomplish, without having to mess with code.
This convenience and ease of use extends to InetSoft's reporting interface, which won on Steps to Answer, Scorecards, Data Transformation, Data Modeling, WYSIWYG Report Design, and Integration Apis.
InetSoft Scored Higher than Tableau in the Following Areas

- Meet Requirements
- Ease of Use
- Ease of Setup
- Ease of Admin
- Quality of Support
- Ease of Doing Business With
- Steps to Answer
- ScoreCards
- Data Transformation
- Data Modeling
- WYSIWYG report Design
- Integration APIs
- Calculated fields
- Data Column Filtering
- Search, and Collaboration/Workflow
- Sandbox/Test Environments
- Customization
- User, Role, and Access Management
- Breadth of Partner Applications
How a Jute Twine Manufacturer Switched from Tableau to the Open Source StyleBI for Business Intelligence
The jute twine manufacturing industry, though niche, plays a crucial role in supplying sustainable materials for agriculture, packaging, and craft applications. Like many specialized manufacturing sectors, efficient management of production, inventory, supply chains, and customer demand relies heavily on data-driven insights. Traditionally, Green Fiber Co. have employed business intelligence tools such as Tableau to monitor operations, generate reports, and make informed strategic decisions. However, evolving operational requirements, cost considerations, and the need for more flexible embedded analytics have prompted many companies to explore alternatives like the open source StyleBI platform.
Understanding the Jute Twine Manufacturing Business
Jute twine is a natural fiber product derived from the jute plant, known for its strength, durability, and biodegradability. Manufacturers process raw jute fibers into twines of various thicknesses and lengths, catering to industries ranging from agriculture—where twine is used for baling crops—to packaging and handicrafts. Operational efficiency depends on several factors, including raw material quality, production line performance, labor utilization, and energy consumption. Data collected across these areas forms the foundation for business intelligence, enabling companies to optimize processes, maintain quality standards, and forecast demand accurately.
Manufacturing operations generate a wealth of multidimensional data: raw jute procurement records, fiber quality assessments, machine throughput, production batch yields, energy usage, inventory levels, shipment schedules, and sales metrics. Analyzing this data using a robust BI platform can reveal inefficiencies, track KPIs, and support proactive decision-making. Historically, Tableau has served as a popular choice for visualizing this data, but several challenges have emerged over time.
Limitations of Tableau for Green Fiber Co.
While Tableau provides strong data visualization capabilities, some limitations make it less suitable for certain niche manufacturing contexts. First, embedding Tableau dashboards directly into internal applications or production monitoring systems can be technically complex, requiring additional IT resources. Second, managing complex multi-dimensional queries from OLAP databases or other enterprise systems often necessitates pre-processing data or creating multiple intermediate data extracts, which can slow down insight generation. Finally, licensing costs for Tableau may be prohibitive for smaller manufacturers with limited BI budgets, especially when scaling analytics across multiple departments or facilities.
Advantages of Switching to StyleBI
StyleBI offers a compelling alternative, particularly in open source form, with a focus on embedded analytics, flexibility, and direct connectivity to multidimensional data sources. For Green Fiber Co., several benefits stand out:
- Embedded Dashboards: StyleBI allows dashboards and visual analytics to be integrated directly into existing operational applications, giving production managers, quality engineers, and executives immediate access to insights without navigating external platforms.
- Direct OLAP Connectivity: StyleBI connects natively to OLAP and relational databases, enabling real-time data querying and dynamic visualization without the need for pre-aggregated datasets.
- Interactive Visualizations: Users can drill down from high-level KPIs to batch-level production data, quickly identifying bottlenecks, inefficiencies, or quality issues.
- Cost Efficiency: As an open source platform, StyleBI reduces licensing costs and allows customization without restrictive vendor contracts.
- Role-Based Views: Dashboards can be tailored to different user roles—operators, engineers, supply chain managers, and executives—ensuring relevant data is delivered to the right audience efficiently.

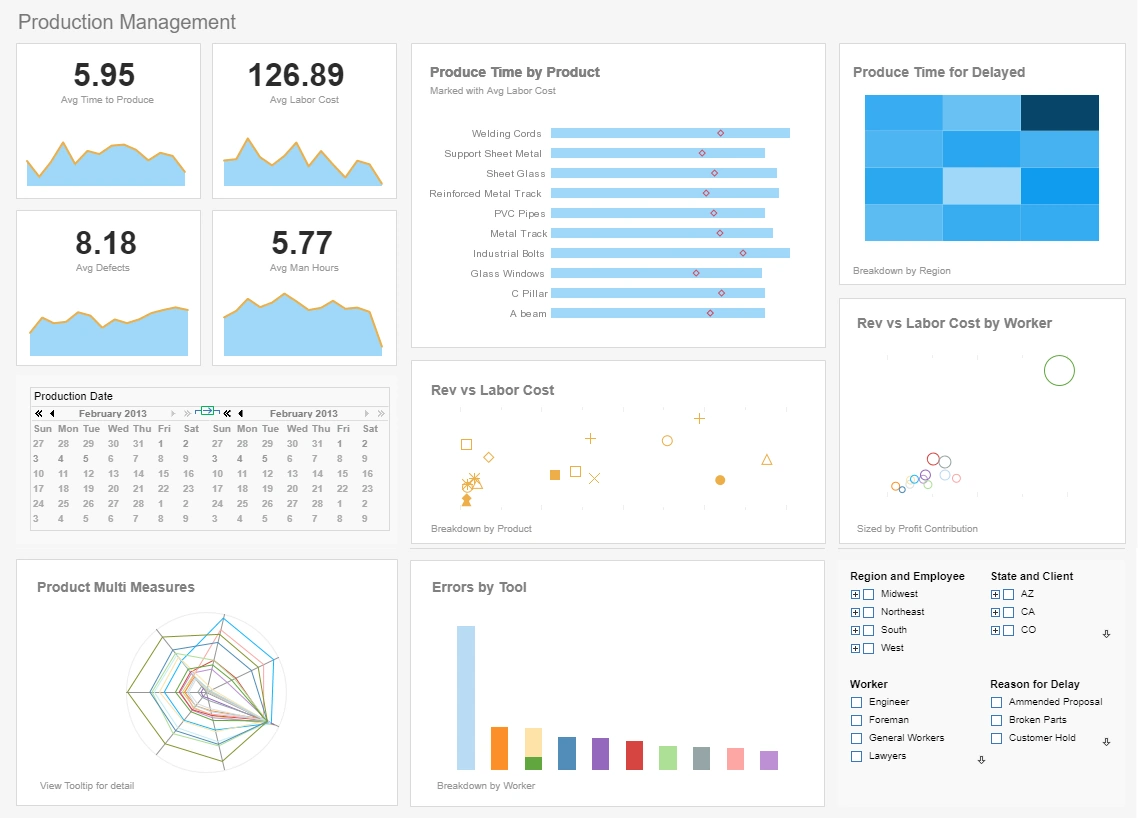
Operational Dashboards for Jute Twine Production
StyleBI enables the creation of operational dashboards that are highly specific to the production and refinement of jute twine. Examples include:
- Raw Material Quality Dashboard: Tracks fiber quality metrics, such as fiber length, tensile strength, and moisture content. By monitoring these indicators, procurement teams can make better decisions about sourcing and manage supplier quality standards.
- Production Efficiency Dashboard: Displays machine utilization rates, throughput per shift, and batch completion times. Engineers can identify underperforming machinery or processes, helping optimize production schedules and minimize downtime.
- Energy and Resource Monitoring: Tracks electricity, water, and labor consumption per unit of twine produced. This dashboard helps in implementing cost-saving measures and improving sustainability.
- Inventory and Supply Chain Dashboard: Monitors stock levels, incoming raw materials, and finished goods inventory. Managers can make informed decisions about procurement, storage, and shipment schedules.
- Sales and Customer Analytics: Provides visibility into customer orders, regional demand, and revenue trends. Sales teams can adjust production priorities based on real-time demand patterns.
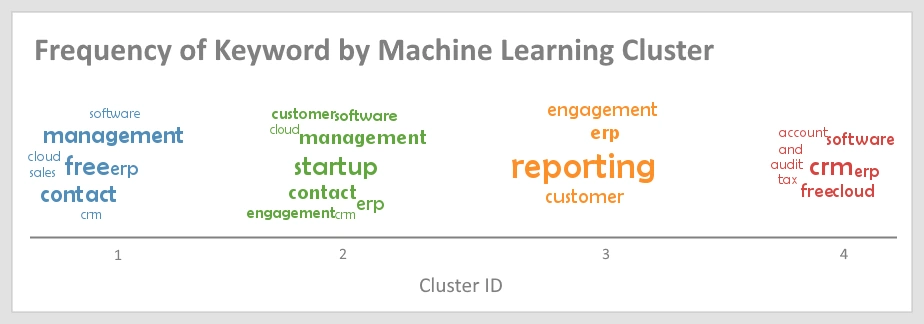
Visual Analytics Capabilities in StyleBI
StyleBI offers rich visualizations that transform raw operational data into actionable insights. Time-series charts help track production volumes, quality metrics, and energy consumption trends over weeks, months, or years. Scatter plots and correlation matrices can identify relationships, such as the impact of fiber moisture content on final twine strength or the correlation between machine utilization and energy consumption. Interactive filters and parameter controls, including sliders, allow users to explore data ranges, simulate production scenarios, and perform what-if analysis directly on the dashboard.
Driving KPIs with StyleBI
StyleBI enables Green Fiber Co. to focus on critical KPIs that influence operational efficiency and profitability:
- Machine Utilization Rate: Measures the proportion of production capacity being effectively used. Low utilization may indicate maintenance issues or suboptimal scheduling.
- Batch Yield Ratio: Tracks the efficiency of converting raw jute into twine. Dashboards can highlight batches that fall below expected yield percentages.
- Energy Consumption per Ton: Provides insights into operational efficiency and cost management, supporting sustainability initiatives.
- Quality Defect Rate: Identifies twine batches that fail to meet tensile or dimensional specifications, enabling corrective actions in production processes.
- Delivery Timeliness: Monitors on-time delivery rates for customer orders, helping logistics teams improve service levels.
Implementation Strategy for Transition
Transitioning from Tableau to StyleBI requires careful planning to ensure continuity, minimize disruption, and maximize the benefits of embedded analytics:
- Data Inventory and Mapping: Review all existing Tableau dashboards, datasets, and OLAP cubes. Identify which metrics and visualizations are critical for production, quality, and management reporting.
- Prioritize High-Impact Dashboards: Begin the migration with dashboards that deliver the highest operational impact, such as production efficiency, quality control, and inventory management.
- Configure Parameters and Filters: Define the interactive elements in StyleBI, such as sliders, dropdowns, and input fields, to allow dynamic data exploration and scenario analysis.
- User Training: Educate operators, engineers, and managers on how to use StyleBI dashboards, interact with controls, and generate insights from visualizations.
- Validation and Parallel Run: Operate Tableau and StyleBI dashboards in parallel for a defined period to validate data accuracy, ensure consistency, and collect user feedback.
- Full Deployment and Integration: Once validated, fully migrate to StyleBI, embedding dashboards into operational applications and ERP systems for seamless access.

Benefits Realized Post-Migration
After switching to StyleBI, Green Fiber Co. can achieve tangible benefits in operational efficiency and decision-making. Embedded dashboards allow instant access to critical metrics, eliminating delays caused by separate reporting systems. Real-time connectivity to OLAP databases enables quick analysis and faster response to production anomalies or quality deviations. Interactive controls allow managers to perform scenario planning, such as simulating production adjustments based on anticipated demand or resource constraints.
Cost advantages are also significant. As an open source platform, StyleBI reduces licensing and subscription expenses, freeing budget for additional operational initiatives. Role-based dashboards ensure that each user group receives relevant insights without overwhelming them with unnecessary data. Operational KPIs become easier to monitor, improving overall process optimization and profitability.
Strategic Implications of Using StyleBI
The adoption of StyleBI positions Green Fiber Co. for enhanced operational agility and strategic growth. Embedded analytics foster faster decision cycles, better resource allocation, and proactive quality management. Insights derived from StyleBI dashboards support predictive maintenance, energy optimization, and production forecasting. By enabling users to explore data interactively, the platform helps identify inefficiencies and trends that would be difficult to detect through static reporting.
Moreover, the ability to tailor dashboards to specific roles and operational needs enhances engagement and ensures actionable insights reach decision-makers promptly. This capability strengthens the company’s competitive position in the sustainable materials market, allowing for better customer service, improved operational performance, and informed long-term planning.
Overall, migrating from Tableau to StyleBI empowers Green Fiber Co. with a cost-effective, flexible, and interactive BI solution. By leveraging embedded dashboards, real-time OLAP connectivity, and interactive visualizations, manufacturers can improve operational efficiency, maintain high-quality production standards, and make data-driven decisions that enhance profitability and growth within the niche market of jute twine production.