Assets Under Management Dashboards
For asset managers, wealth platforms, and multi-line financial institutions, Assets Under Management (AUM) is more than a vanity metric. It is a central indicator of scale, market relevance, and long-term revenue potential. Modern growth dashboards built around AUM give leaders a unified view of how assets are evolving across products, clients, and geographies, and how those trends translate into sustainable growth.
A well-designed AUM and growth dashboard does not just show a single total. It breaks AUM down by business unit, investment type, and region, and overlays key growth metrics such as compound annual growth rate (CAGR) and performance over time. This combination of structural breakdown and temporal analysis helps executives understand where growth is coming from, where it is stalling, and which levers they can pull to improve outcomes.


Core structure of an AUM and growth dashboard
At the highest level, the dashboard should present a clear, reconciled AUM total, with the ability to drill down into more granular views. The most common dimensions are:
- Business unit: retail, institutional, private wealth, retirement, alternatives, or any internal segmentation that reflects how the firm is organized.
- Investment type: equities, fixed income, multi-asset, alternatives, money market, passive vs. active, or model portfolios.
- Regional performance: AUM by country, region, or sales territory, often aligned with regulatory or distribution structures.
These dimensions allow leaders to see, for example, whether institutional fixed income in a specific region is driving most of the growth, or whether retail equity products are experiencing net outflows. The dashboard should support filtering and slicing across these dimensions so that users can quickly isolate patterns and anomalies.

Tracking CAGR and performance over time
A static snapshot of AUM is not enough. To understand growth dynamics, the dashboard should calculate and visualize compound annual growth rate (CAGR) for AUM over relevant time horizons—such as 1-year, 3-year, and 5-year periods. CAGR smooths out short-term volatility and shows the underlying growth trajectory of each segment.
Alongside CAGR, trend charts for performance over time are essential. These may include:
- Monthly AUM trends with net flows and market impact separated.
- Quarterly growth by business unit and investment type.
- Rolling 12-month growth rates to highlight momentum shifts.
By combining CAGR with shorter-term trend views, decision-makers can distinguish between structural growth and temporary spikes or dips. For example, a product line might show strong recent inflows but weak 3-year CAGR, suggesting that growth is new and potentially fragile. Conversely, a steady positive CAGR with modest short-term volatility may indicate a resilient franchise.
Other relevant KPIs and analytics
While AUM and growth rates are central, a robust dashboard also incorporates additional KPIs and analytics that explain the “why” behind the numbers. Some of the most valuable include:
Net flows and components
Net flows—gross inflows minus outflows—are a primary driver of AUM changes. The dashboard should break AUM movements into:
- Gross inflows by channel, product, and region.
- Gross outflows with reasons where available (e.g., redemptions, mandate losses).
- Market impact to separate performance-driven changes from client-driven flows.
This decomposition helps leaders understand whether growth is coming from new money, market appreciation, or both. It also highlights areas with persistent outflows that may require product changes, pricing adjustments, or targeted retention efforts.
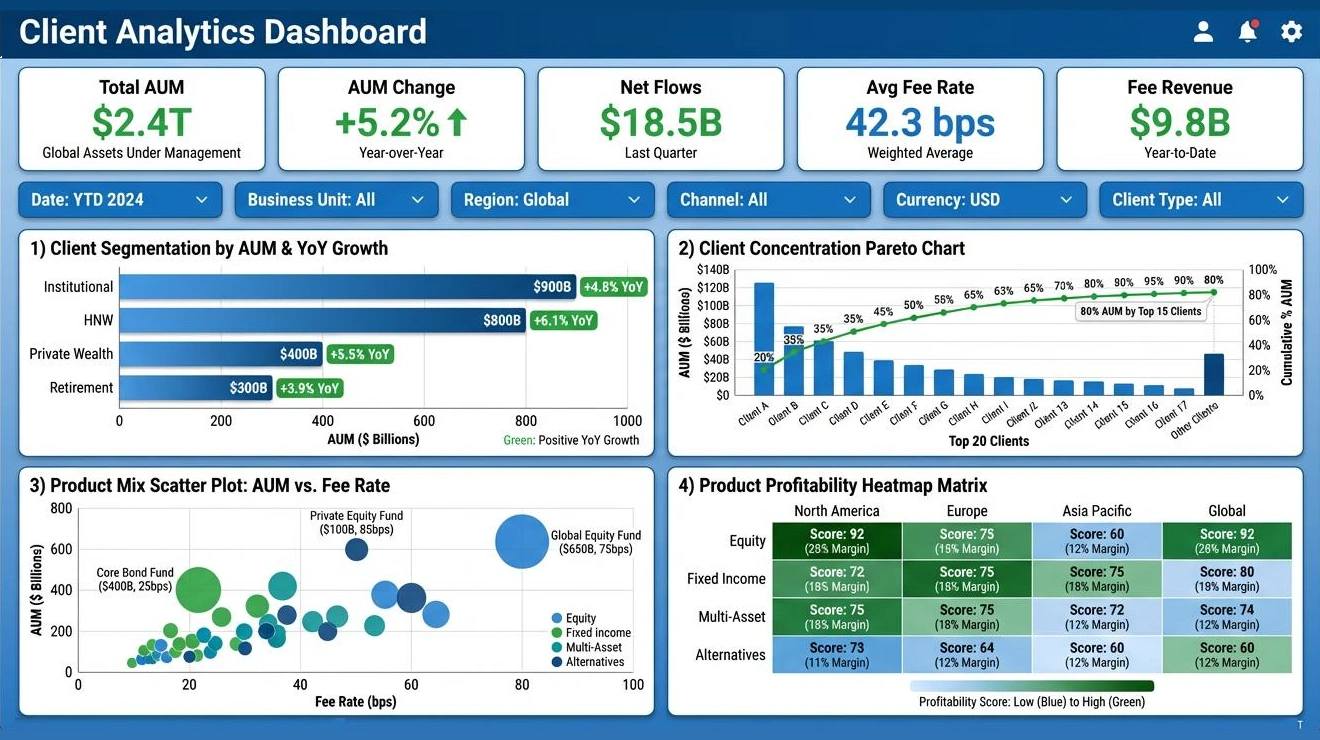
Client segmentation and concentration
Understanding who holds the assets is as important as understanding what those assets are. The dashboard should include client segmentation views that show AUM and growth by client type (e.g., high-net-worth, mass affluent, pension funds, endowments, sovereign wealth).
Concentration metrics—such as the percentage of AUM held by the top 10 clients—help assess the stability of the asset base. High concentration may signal elevated risk if a small number of clients can significantly impact AUM through mandate changes or redemptions.

Product mix and profitability
Not all AUM is equally valuable. The dashboard should connect AUM to product mix and economics. For each segment, it is useful to track:
- Average fee rate (basis points) by product and channel.
- Fee revenue derived from AUM, ideally at a granular level.
- Margin contribution where cost allocations are available.
This allows leaders to see whether growth is occurring in high-fee, high-margin strategies or in lower-fee, commoditized products. AUM growth that dilutes overall fee rates may still be strategically important, but it should be recognized and managed explicitly.
Risk and performance analytics
AUM growth is more sustainable when it is supported by strong investment outcomes. Integrating risk-adjusted returns and benchmark-relative performance into the dashboard helps connect growth with investment quality.
- Excess return versus benchmark over multiple horizons.
- Volatility measures and drawdown statistics for key strategies.
- Upside/downside capture to show behavior in different market regimes.
When performance is strong but AUM is flat, the issue may be distribution or pricing. When AUM is growing despite weak performance, it may reflect brand strength, sales incentives, or delayed client reactions—signals that warrant close monitoring.

Sales funnel and pipeline metrics
To make the dashboard forward-looking, many firms integrate sales and pipeline data. This can include:
- Opportunities in pipeline by stage, expected AUM, and probability.
- Win/loss rates by product, region, and client type.
- Time to close for institutional mandates or large advisory relationships.
These metrics help forecast future AUM and identify bottlenecks in the sales process. They also allow leaders to align marketing and distribution resources with the most promising segments.

Design and data considerations
To be trusted and widely adopted, an AUM and growth dashboard must be built on strong data governance and clear definitions. AUM should be consistently defined across systems and business units, with transparent rules for inclusions, exclusions, and valuation timing.
From a design perspective, the dashboard should:
- Prioritize clarity with simple, intuitive visuals for executives.
- Support drill-down for analysts and power users who need detail.
- Highlight exceptions using alerts or conditional formatting for unusual flows or performance.
Role-based views can ensure that each audience—executives, product heads, regional leaders, and sales teams—sees the most relevant slices of AUM and growth data without being overwhelmed.
Using AUM dashboards to drive action
The real value of an AUM and growth dashboard lies in the decisions it enables. When leaders can see AUM by business unit, investment type, and regional performance alongside flows, performance, and profitability, they can:
- Reallocate resources toward high-growth, high-margin segments.
- Revamp products that show persistent outflows or weak performance.
- Target retention efforts at concentrated or at-risk client segments.
- Align incentives so that sales and product teams focus on sustainable growth.
Over time, the dashboard becomes a shared language for growth—connecting investment teams, distribution, finance, and leadership around a common view of where the firm is today and where it is heading.
