Replacing Flash-Based Dashboards and Reporting
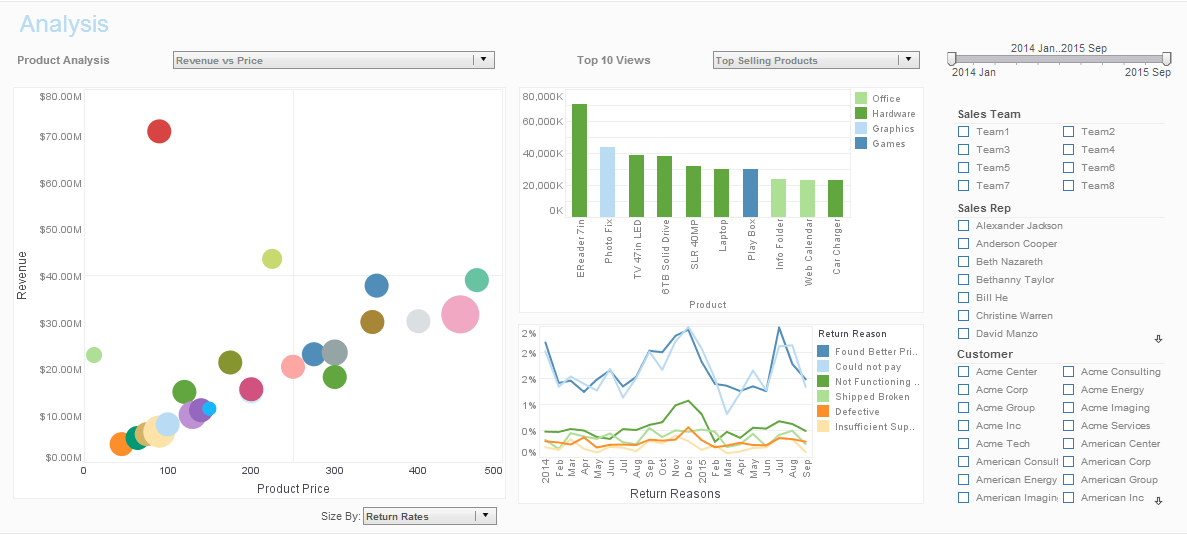
InetSoft's dashboard and reporting applications provide business users with an HTML5 based interface, instead of Flash, that's as simple as using a web browser. Executives and analysts no longer require advanced technical abilities, and can create custom visualizations and reports in a highly interactive, self-service environment that allows for multi-dimensional and drill down analysis.
Our solutions are 100% Java so they can be deployed in any computing topography providing the easiest support for large numbers of users whether they be inside or outside of the organization, wherever geographically they may be dispersed, and whatever computing platform they run.
Applications of InetSoft Business Intelligence Technology
As StyleBI is a very horizontal market application it is used by many different functions in many different sectors. Our over 5,000 customers have come from industries such as financial services, healthcare, pharmaceuticals, technology, manufacturing, and entertainment as well as non-profit segments including government and education.
InetSoft customers can be found in all parts of the world with concentrations in the Pacific Rim, India, the Middle East, Western Europe, and North America. The software can be deployed enterprise-wide and is also deployed to serve specific departments such as sales, marketing, finance, and operations.
More Articles About Dashboards
Crisis Management Dashboard Example
Including anything from severe weather events to public health crises to cyberattacks and economic downturns. For an organization to minimize harm, ensure the safety of its stakeholders, and maintain its reputation, crisis management must be done effectively. Dashboards for crisis management have become effective tools for tracking, evaluating, and reacting to crises in real time.
Drilling Down into Emergency Reports
With InetSoft's easy-to-use drag and drop design tools, emergency service providers can quickly build productive analytical tools that aid users in day-to-day operations, as well as help them keep track of and achieve long term goals and objectives.
InetSoft has a library of charts and visualization types to choose from, including geographic mapping, heat maps, and scatter plots. Healthcare industry executives can cater any completed dashboard to specific needs at any given time and even access them from mobile devices such as smartphones and tablets.
Evaluate InetSoft's Vendor Management Dashboard Tool
Are you looking for a good tool to make a vendor management dashboard? InetSoft's pioneering dashboard reporting application produces great-looking web-based dashboards with an easy-to-use drag-and-drop designer.
Get cloud-flexibility for your deployment. Minimize costs with a small-footprint solution. Maximize self-service for all types of users. No dedicated BI developer required. View a demo and try interactive examples.
Examples of Medical Dashboards
Are you looking for medical dashboard examples? Try out this interactive mortality analysis dashboard from the InetSoft live dashboard gallery. This dashboard was made with InetSoft's commercial dashboard builder StyleBI.
The ease of use and high level of interactivity in this example are proof of InetSoft's core concept of deploying advanced visualization without sacrificing computing power.
Interactive Report Parameters
A parameter is any input that you enter. Run the 'Parameters' report.
You see the first set of parameter choices in the screenshot. Once the state is chosen from the drop-down option box, the second drop-down option box will contain client cities in the state that was selected.
Looking for Consolidated Dashboard Software
Between BI vendors, CRM solutions, marketing programs, and other types of informational solutions, companies often find themselves with numerous dashboards and reporting options from different providers, all designed for different purposes and data sources. Analysts are left to sort through multiple solutions to find observations that will hopefully add up to meaningful insights.
Selecting KPIs Bottom-Up or Top-Down
This is one of the most challenging issues in business intelligence. It’s unlike any other software segment, where you can define your requirements, and you can define your metrics, take CRM or ERP, for instance, and you will probably be OK with what you set up for a couple of years with just minor changes.
But business intelligence and performance management are completely different. Because by design, you go through the regular cycle of defining your metrics.
What Are the Operations of OLAP?
OLAP (Online Analytical Processing) is a multidimensional analysis and reporting technology that enables businesses to quickly analyze and explore their data. OLAP operations can be classified into two categories: Slice and Dice and Roll-up and Drill-down. "Slice and Dice" operations allow users to analyze data from different perspectives. They involve selecting a subset of data from a multidimensional dataset based on one or more criteria. The two types of "Slice and Dice" operations are described further in the guide.


