What Is KPI Signal-to-Noise Ratio?
Organizations collect more business data than ever before, yet not all metrics provide useful insights. Many dashboards contain KPIs that fluctuate constantly, creating confusion instead of clarity. The concept of KPI Signal-to-Noise Ratio helps distinguish meaningful business trends from random variations and distractions.

Definition of KPI Signal-to-Noise Ratio
KPI Signal-to-Noise Ratio (SNR) measures how much meaningful information a KPI delivers compared to the amount of random fluctuation, measurement error, or irrelevant variation present in the metric.
In business intelligence, the signal represents genuine performance changes that reflect business conditions, while the noise consists of natural variability, data quality issues, seasonal fluctuations, reporting inconsistencies, or insignificant changes that do not require action.
A KPI with a high Signal-to-Noise Ratio provides clearer guidance for decision-makers. A KPI with a low Signal-to-Noise Ratio generates frequent fluctuations that may cause unnecessary reactions and poor decisions.
Simple Example
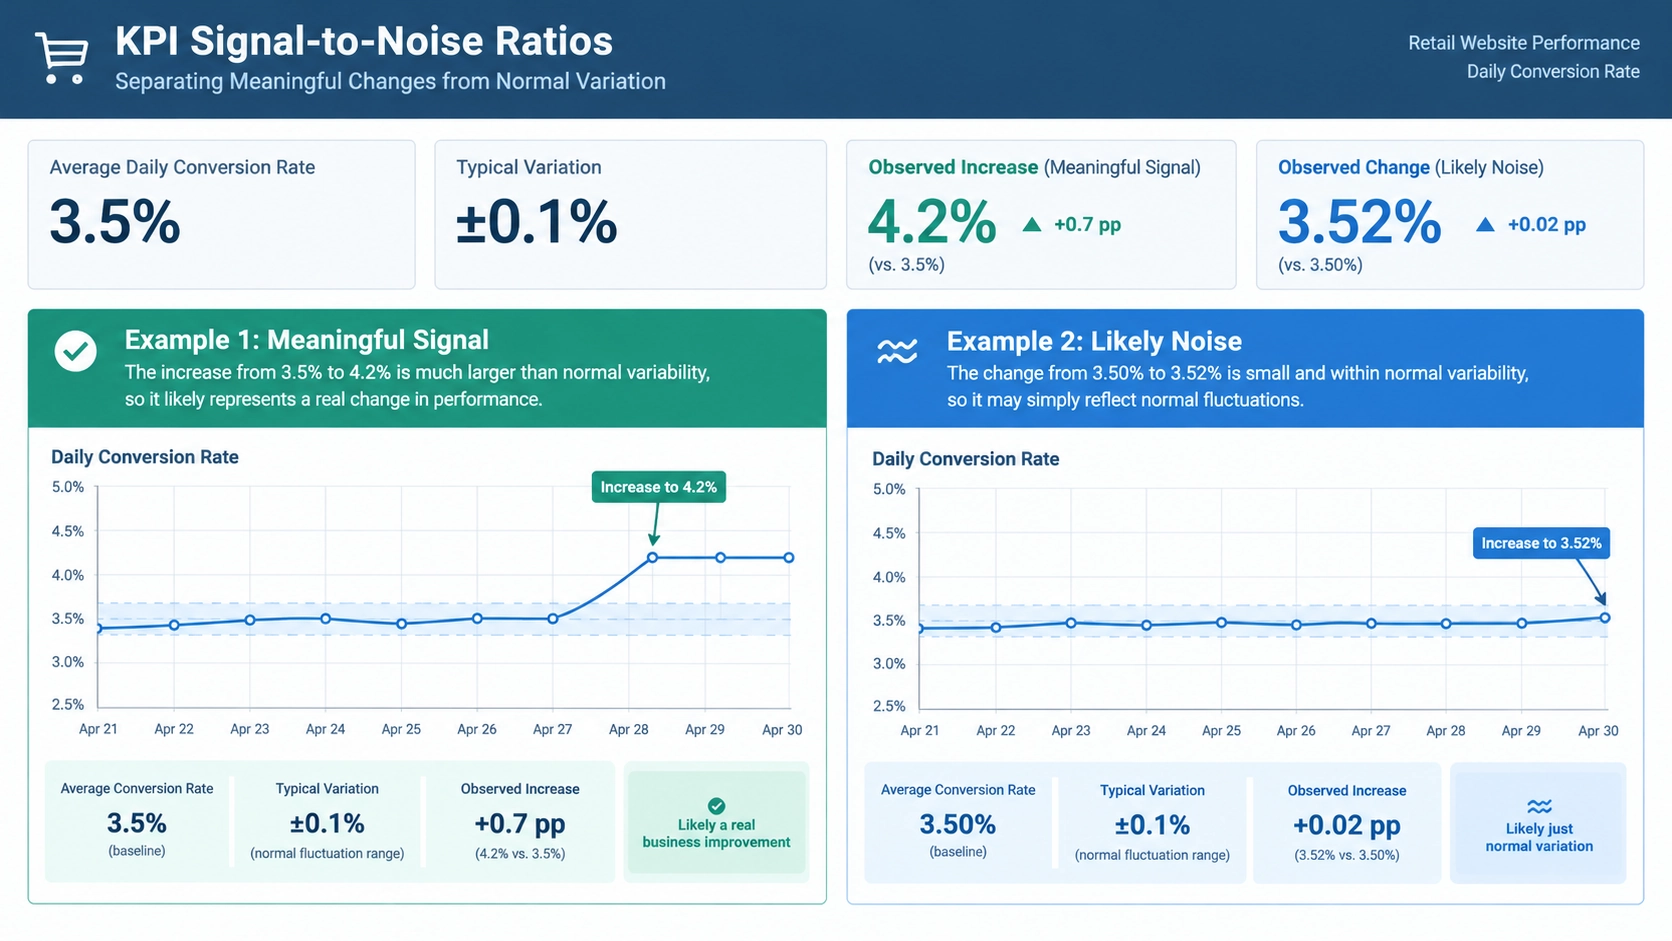
Imagine a retailer tracking daily website conversions.
- Average daily conversion rate: 3.5%
- Typical variation: ±0.1%
- Observed increase to 4.2%
Because the increase is much larger than normal variability, the change likely represents a meaningful signal rather than random noise.
Now imagine the conversion rate changes from 3.50% to 3.52%. That difference may simply reflect normal fluctuations and does not necessarily indicate any genuine business improvement.
Why KPI Signal-to-Noise Ratio Matters
Many organizations suffer from metric overload. Leaders review hundreds of charts and alerts without knowing which changes deserve attention. Signal-to-Noise Ratio helps organizations focus on metrics that truly indicate changing business conditions.
Benefits include:
- Better decision-making.
- Reduced false alarms.
- Greater confidence in KPI reporting.
- Improved dashboard usability.
- Higher trust in analytics programs.
- More effective performance management.
Common Sources of KPI Noise
Noise can enter business metrics from many sources.
- Data entry errors.
- Incomplete data collection.
- Small sample sizes.
- Short-term seasonal effects.
- System processing delays.
- Reporting inconsistencies.
- Temporary operational disruptions.
- Changes in metric definitions.
When noise levels rise, KPI reliability tends to decline.
How to Evaluate a KPI's Signal-to-Noise Ratio
Organizations can assess KPI quality by examining:
- The consistency of historical measurements.
- The size of meaningful business changes.
- The frequency of unexplained fluctuations.
- The statistical variability of the metric.
- The accuracy of source data.
Analysts often compare the magnitude of true business movement against the metric's normal variability. The larger the meaningful movement relative to normal variation, the stronger the signal.
Real-World Example
A subscription software company monitors monthly customer churn.
Historically, churn varies between 4.8% and 5.2% each month. During one quarter, churn rises steadily to 7.1%. Because this increase exceeds the normal range of variation, the KPI presents a strong signal that customer retention problems may exist.
The company investigates onboarding processes, customer support performance, and product usage data before taking corrective action.
Using StyleBI to Improve Signal Detection
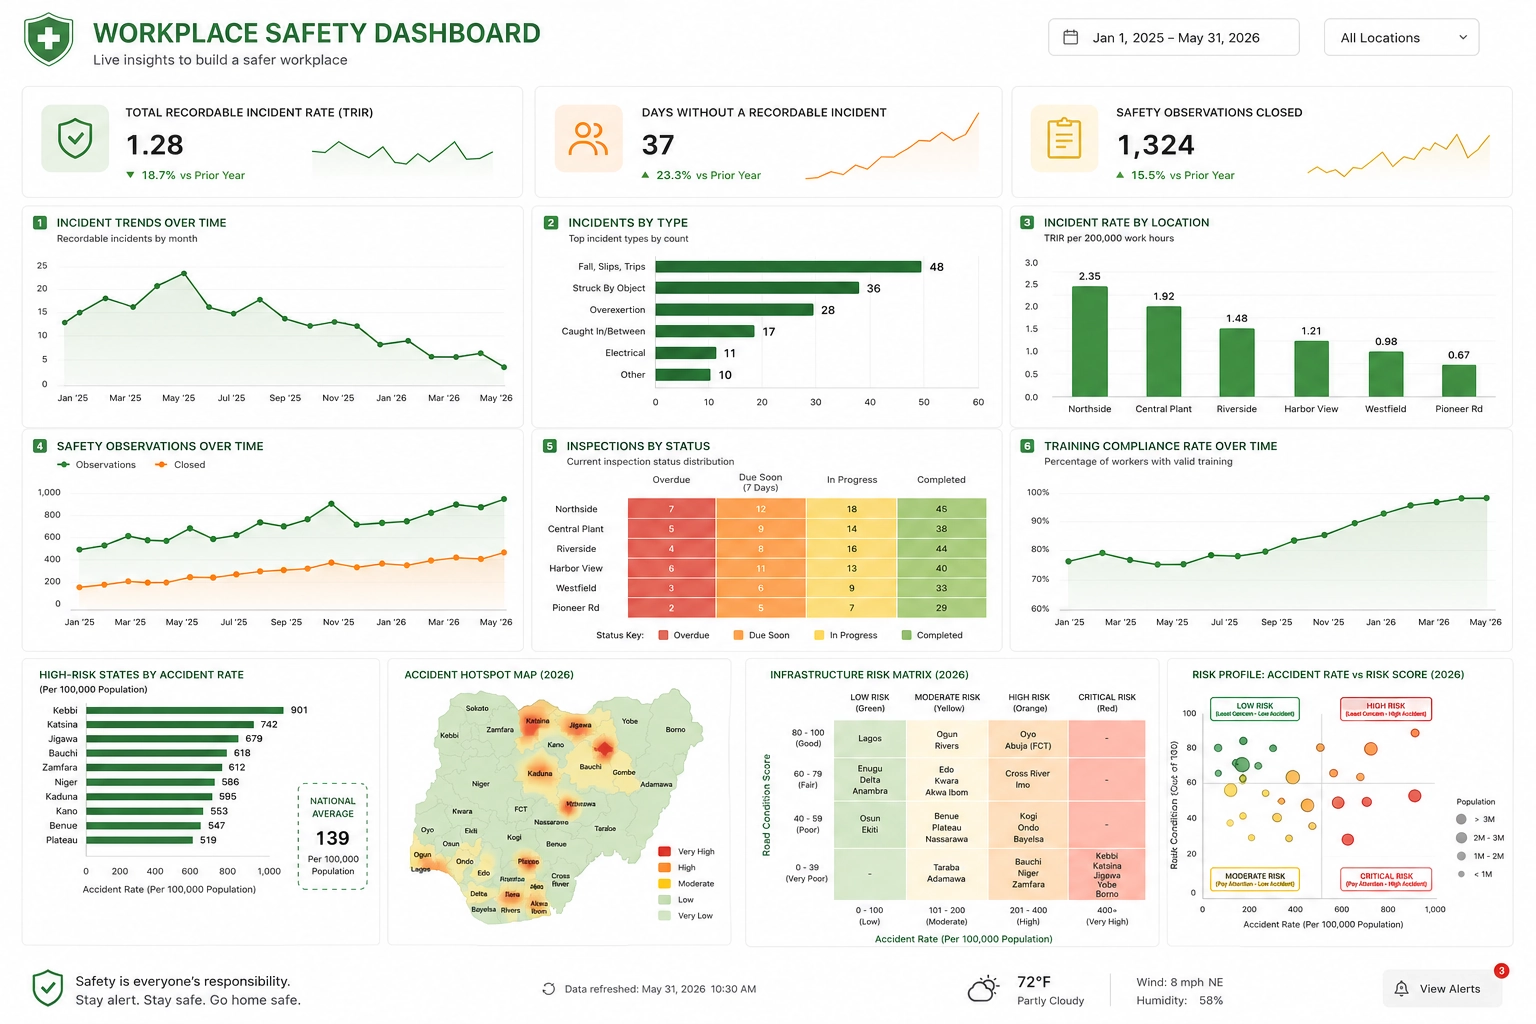
Organizations using StyleBI can build dashboards that distinguish meaningful KPI changes from routine fluctuations.
Features such as trend analysis, threshold monitoring, anomaly detection, historical comparisons, and visual alerts help decision-makers focus on metrics that demonstrate genuine business significance.
Rather than reacting to every small change, users can identify patterns that consistently exceed expected variability and warrant investigation.
How to Improve KPI Signal-to-Noise Ratio
- Standardize KPI definitions.
- Improve data quality controls.
- Eliminate duplicate metrics.
- Use larger sample sizes when possible.
- Apply rolling averages and trend analysis.
- Monitor data governance practices.
- Establish KPI ownership.
- Retire low-value metrics.
Improving metric quality often increases confidence in reporting and reduces decision-making errors.
Related KPI Governance Concepts
- KPI Volatility
- Metric Drift
- Certified Metrics
- Metric Ownership
- KPI Inflation
- Composite KPIs
- Dashboard Adoption
- Analytics Sprawl
Together, these concepts help organizations create trustworthy and actionable business intelligence environments.
Increase the Value of KPI Programs
KPI Signal-to-Noise Ratio is a measure of how effectively a metric communicates meaningful business performance versus random fluctuation. High-SNR KPIs help decision-makers identify genuine trends, respond appropriately to changing conditions, and avoid overreacting to insignificant variations. By improving data quality, standardizing metrics, and implementing strong analytics governance, organizations can increase the value of their KPI programs and make more informed decisions.