How a Gold Mining Company Struck It Rich by Switching from Polymer to InetSoft for Its Scorecard Dashboards
Digging Deeper:
For Crestline Gold Operations, a mid-sized gold mining company with active sites spread across Nevada and northern Canada, data has always been the invisible seam running beneath every decision. From tracking ore grades and mill throughput to monitoring equipment uptime and safety compliance, the company generates thousands of data points every single day. For several years, Crestline relied on a custom-built dashboard and scorecard solution built on Google's Polymer web component framework. It was a decision that made sense at the time — Polymer was modern, flexible, and offered a clean component-based architecture. But as the company grew and its reporting needs became more sophisticated, the cracks began to show.
The Limitations of a DIY Approach
Polymer, while a capable front-end framework, was never designed to be a business intelligence platform. It is a tool for building web components — and Crestline's IT team had worked hard to construct a bespoke reporting system around it. The effort required to maintain that system, however, proved unsustainable. Every new KPI the operations team requested meant additional development cycles. Every change to an underlying data source could break a dashboard that had taken weeks to build. The system was fragile, expensive to maintain, and deeply dependent on a small group of internal developers who understood its custom architecture.
"We were spending more time fixing the tool than using it," said Marcus Delacroix, Crestline's Director of Operational Intelligence. "Our analysts would ask for a new scorecard view and we'd have to tell them it would take six to eight weeks. That's not acceptable when you're making production decisions in real time."
The situation was compounded by Google's announcement that Polymer would be deprecated in favor of Lit, its successor library. While the transition path existed, it required a significant re-engineering effort — effort that Crestline's team felt was better invested elsewhere. The writing was on the wall: it was time to find a dedicated analytics and dashboard solution.

The Search for a Purpose-Built Platform
Crestline's IT and operations leadership evaluated several business intelligence platforms before landing on InetSoft. The criteria were demanding: the platform needed to support real-time data connectivity to the company's historians and ERP systems, offer a robust scorecard framework with configurable KPIs, and — critically — allow non-technical users to build and modify their own dashboards without filing a development ticket.
InetSoft checked every box. Its Style Intelligence platform, which combines data mashup capabilities with interactive dashboards and scorecards, offered the kind of depth that Crestline needed without sacrificing ease of use. The platform's ability to connect to heterogeneous data sources — including the company's OSIsoft PI historian, its SAP ERP system, and a custom SQL database tracking laboratory assay results — was a decisive factor.
"InetSoft spoke our language," said Delacroix. "We weren't just getting a chart builder. We were getting a full scorecard engine that could roll up metrics from the pit all the way to the executive boardroom."
Implementation and the Scorecard Transformation
The migration from Polymer to InetSoft took approximately four months, a timeline that surprised even the most optimistic members of Crestline's leadership team. InetSoft's professional services team worked alongside Crestline's IT staff to map existing KPIs from the old system into the new scorecard framework. Rather than simply replicating what had existed before, the implementation became an opportunity to rethink how performance was measured across the organization.
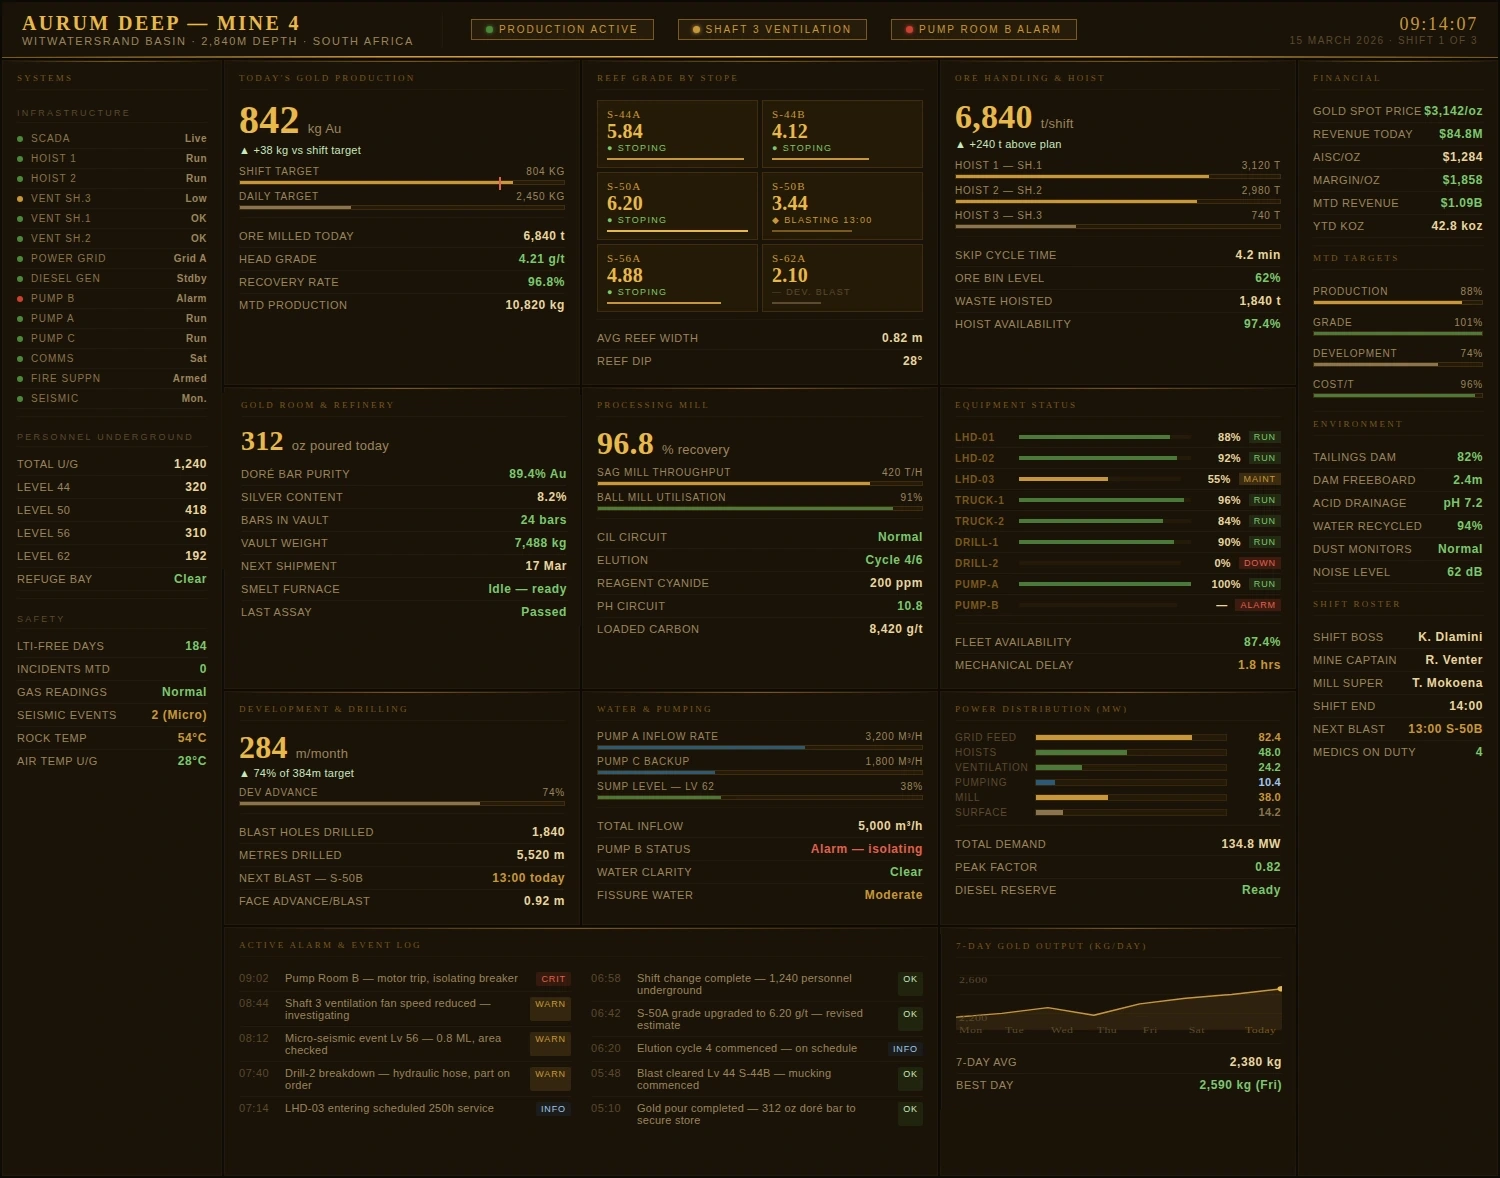
Under the new system, Crestline built hierarchical scorecards that cascaded from site-level performance indicators down to individual shift and equipment metrics. A mine site superintendent could now open the InetSoft portal each morning and immediately see a color-coded scorecard summarizing recovery rates, tonnes processed, energy consumption per tonne, and safety observations — all with drill-down capability that had previously required a developer to build a new report from scratch.
The dashboards were equally transformed. Where the Polymer-based system had offered static chart views that required a page refresh to update, InetSoft's dashboards pulled live data and refreshed automatically. Operations managers monitoring the milling circuit could watch throughput and grind metrics update in near real time, allowing them to catch inefficiencies before they cascaded into production losses worth tens of thousands of dollars per hour.

Results in the Field
Six months after going live with InetSoft, the results at Crestline were measurable and meaningful. The time required to create a new scorecard or dashboard dropped from weeks to hours. The operations team's reliance on IT for reporting requests fell by over sixty percent. And perhaps most significantly, the quality of daily production meetings improved markedly — managers arrived with shared, consistent data rather than competing spreadsheets pulled from different systems.
The company also reported a reduction in the number of unplanned maintenance events at its primary mill, attributing the improvement in part to better visibility into leading indicators that the new dashboards surfaced earlier than the old system ever had.
A Lesson for the Mining Industry
Crestline's experience is a cautionary tale and a success story rolled into one. The cautionary part: building a business intelligence solution on a general-purpose web framework, however elegant, creates technical debt that compounds over time. The success story: when a purpose-built analytics platform is matched to the operational complexity of a mining enterprise, the returns can be rapid and substantial.
For mining companies still relying on custom-built or cobbled-together dashboard solutions, Crestline's transition to InetSoft offers a clear message. The gold is there. You just need the right tools to get to it.

More Articles About Scorecard Dashboards
Drag and Drop Dashboard Builder - Are you looking for a good drag and drop dashboard builder? InetSoft's pioneering dashboard application produces great-looking web-based dashboard with an easy-to-use drag and drop designer. Get cloud-flexibility for your deployment. Minimize costs with a small-footprint solution. Maximize self-service for all types of users. No dedicated BI developer required. View a demo and try interactive examples...
Drill-down Capable Dashboard - Looking for dashboard software with drill down capabilities? InetSoft features drill down dashboards that are visually oriented and fully interactive. By pointing and clicking over a data point or even by hovering over it, users can explore data and drill into more details. The ability to summarize information so easily vastly improves efficiency and provides analysts and decision makers with all the right tools for the job...
Drill-down Dashboard Example - What is an example of drill-down in the customer relationship management scenario? A good example is getting business intelligence on individual customers. You can understand their entire purchase behavior history. You can see what they purchase, and this is how drilling down can help close more deals, close them more quickly, generate cross selling opportunities and increase revenues. When you understand that this is what you can do, for the individual sales rep, first you summarize the information so it’s understandable to him or her. Then it should be intuitive where to drill down to help make the specific decision. When you start offering a dashboard initially, you want to create a team that has a lot of expertise. Someone should be very experienced with dashboard intelligence, in the ideal world, in your organization. You also want to have a business analyst who responsible for collecting the requirements of the key performance indicators. And of course, you want the people who will be using the dashboard. Lastly you are going to have to work with the database team as well to make sure there are actual data behind these KPIs...
Drill-down Dashboard Solution - Looking for highly interactive dashboard reporting software to enable maximum self-service, data exploration, and ad hoc reporting? InetSoft offers a small-footprint, full-featured BI platform that can be deployed on commodity servers. The single Web-based application provides a streamlined, intuitive interface for all users, business executives and database analysts...
Dynamic Dashboarding - Dynamic dashboarding is the next giant leap in the evolution of Business Intelligence Software. Every component in a Viewsheet has certain properties that can be made “dynamic,” or dependent on other components. These properties can be set either by an input component or by a logical expression. For example, you can use a radio button to specify the Y-axis field in a chart, or use an expression to add highlights to cells of a table. You can use input controls to set aspects of component formatting and data presentation. By associating an input control such as a RadioButton or ComboBox with the property setting for a component, you allow the user to adjust that setting by manipulating the corresponding control. To control a component property using an input control, follow these steps: 1. Create and configure the input control. Follow the steps below: a. Add the desired input control (RadioButton, CheckBox, etc.) to the Viewsheet. b. Right-click the input component, and select ‘Properties’ from the context menu. This opens the ‘Properties’ dialog box for the input component...
Dynamic Dashboarding Properties - InetSoft gives you full control over Dynamic Dashboarding Properties enabling you with the power to create whatever is in your mind. In this example, you will add a RadioButton input that allows the user to set the Y-axis field of a chart to either ‘Quantity Purchased’ or ‘Total Revenue’. 1. Create a Viewsheet based on the ‘ProductSales’ Data Worksheet in the ‘Tutorial’ folder. 2. Add a radio button to the Viewsheet, with two embedded values (‘Quantity Purchased’ and ‘Total’). 3. Add a chart to the Viewsheet and bind it to the ‘SalesByDate’ Data Block. Add the ‘State’ field as the X-axis and the ‘Quantity Purchased’ field as the Y-axis. 4. Click the ‘Quantity Purchased’ menu to select it. 5. Click the ‘down arrow’ next to the menu, and choose the ‘Variable’ option. This populates the menu with all of the available variable names. 6. From the list of variables, choose ‘$(RadioButton)’. 7. Now click the radio buttons. Note that the chart displays the Y-axis field that you choose using the radio button control...

Dynamic Dashboarding Values - Matching dynamic dashboard values allows you to link complex and seemingly unrelated information into an elegant data-filled tapestry. When you link an input control with a component property, you should ensure that the input control evaluates to a permissible value for the particular property. There are three main cases. If a property requires a numerical value, the input control should provide an appropriate numerical value. For example, the ‘Ranking’ property in the Chart data binding requires an integer value. An appropriate control for this property would therefore be a Spinner with ‘Increment’ property set to an integer value. If a property has a ‘True’ or ‘False’ setting, the input control should provide a Boolean value. For example, the ‘Enabled’ property expects a Boolean value ‘true’ or ‘false’. An appropriate control for this property would therefore be a RadioButton with embedded list values {true, false}, and with ‘Data Type’ set to ‘Boolean’...
Dynamic Dashboards - Dynamic dashboards enable you to create changes as quickly as needed. We all know that in today's volatile market, the ability to change with the times is crucial to survival. You can select contiguous or non-contiguous data in a chart. There are several ways to select data: • Drag the mouse across the data you wish to select. Ctrl-drag to add additional regions to the selection. • Ctrl-click the data you wish to select. • Ctrl-click the X-axis labels to select the corresponding data. • Ctrl-click the legend labels to select the corresponding data (subseries). To zoom in on a particular region of the chart, follow the steps below: 1. Select the region(s) of the chart that you wish to zoom. 2. Click the ‘Zoom’ button in the toolbar. This zooms the chart to display only the data selected. 3. Repeat the above steps to zoom in further. 4. To return to the original chart view, click ‘Clear Zooming’ in the topleft corner...