Seller Health Dashboard
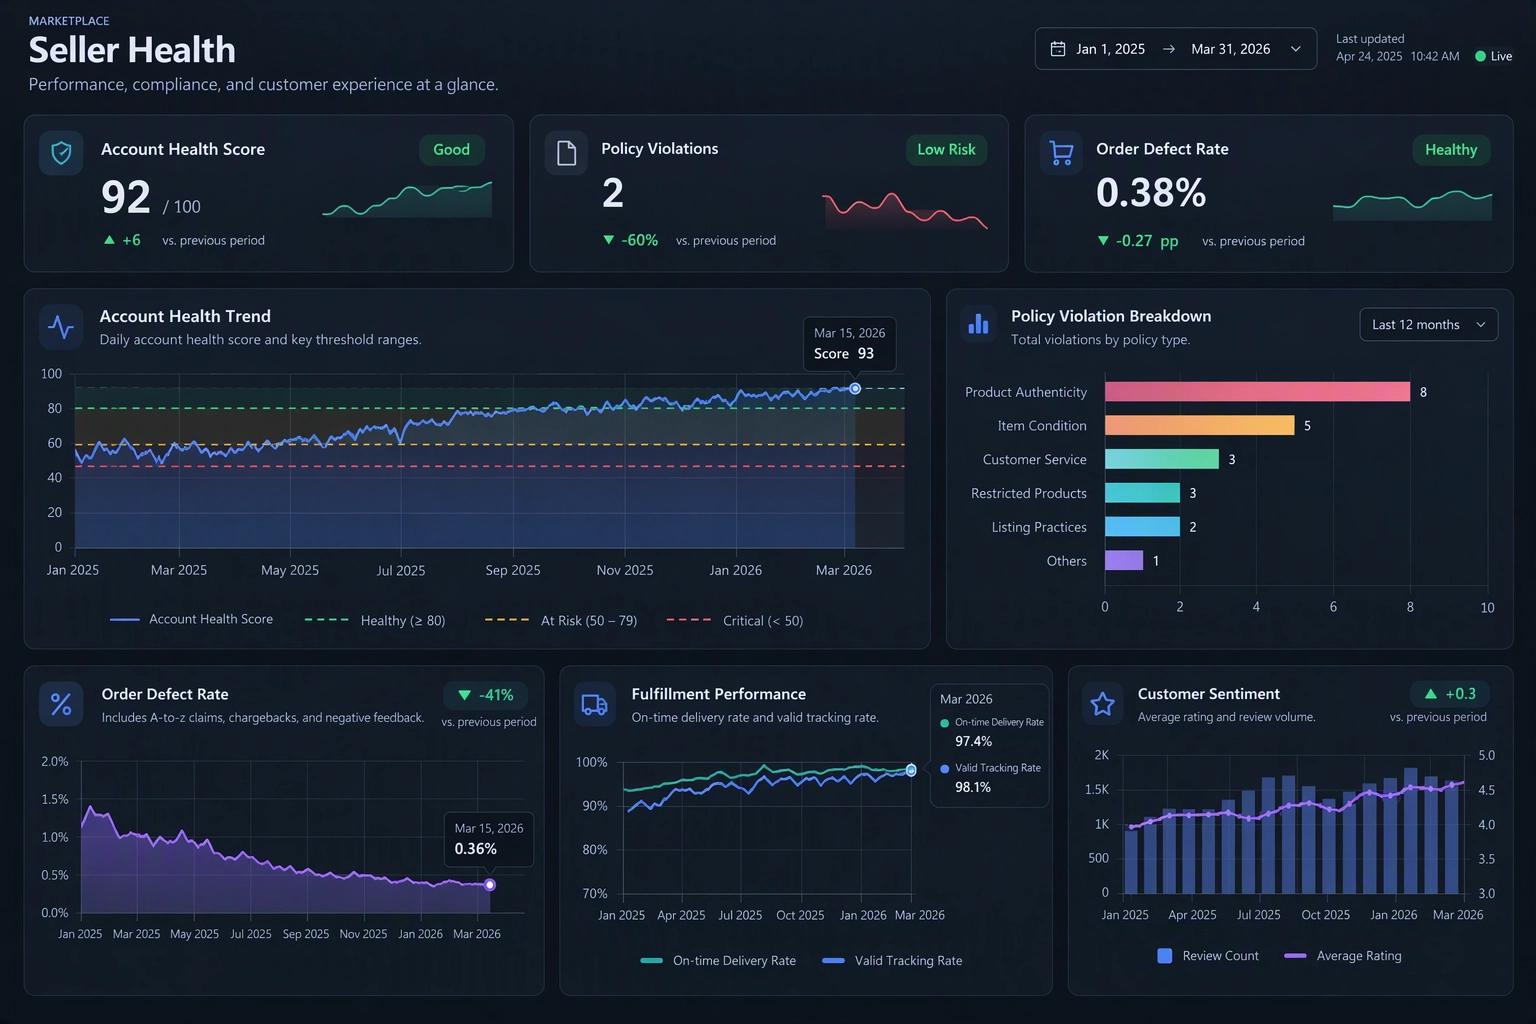
The Seller Health Dashboard provides a centralized view of seller performance, policy compliance, order quality, fulfillment reliability, and customer satisfaction.
The dashboard is designed to help sellers monitor key performance indicators (KPIs), identify potential risks, and take corrective action before issues impact account standing or marketplace eligibility.

Dashboard Functionality
The dashboard consolidates operational, compliance, and customer experience metrics into a single interface. Sellers can review current performance, monitor historical trends, compare results against established thresholds, and quickly identify areas that require attention.
Interactive date filters allow users to analyze performance across different reporting periods. Trend indicators and historical charts help determine whether performance is improving, declining, or remaining stable over time.
Account Health Score
The Account Health Score represents the overall condition of a seller account. It combines multiple operational and compliance factors into a single metric that reflects marketplace performance and risk exposure.
What Influences This Metric
- Policy violations and compliance issues
- Order quality and defect rates
- Customer service performance
- Seller responsiveness and operational reliability
- Marketplace policy adherence
How to Improve It
- Resolve policy violations promptly
- Reduce customer complaints and returns
- Maintain accurate product listings
- Provide consistent customer support
- Meet fulfillment and shipping expectations

Policy Violations
The Policy Violations metric tracks instances where products, listings, services, or seller activities do not comply with marketplace policies.
Common Violation Categories
- Product authenticity concerns
- Item condition inaccuracies
- Restricted or prohibited products
- Listing quality issues
- Customer service policy breaches
How to Improve It
- Review marketplace policies regularly
- Maintain accurate product information
- Verify product authenticity documentation
- Remove non-compliant listings quickly
- Implement internal compliance reviews
Order Defect Rate
Order Defect Rate measures the percentage of orders associated with customer dissatisfaction events and acts as a key indicator of order quality.
Factors That Contribute to Defects
- Negative customer feedback
- Chargebacks
- A-to-Z guarantee claims
- Fulfillment failures
- Product quality issues
How to Improve It
- Ship orders accurately and on time
- Respond to customer concerns quickly
- Improve product quality control
- Ensure listings accurately describe products
- Monitor recurring customer complaints
Account Health Trend Chart
This chart visualizes changes in overall account health over time and compares performance against predefined account-health thresholds.
Chart Purpose
- Track long-term account performance
- Identify improving or declining trends
- Monitor movement between risk thresholds
- Measure the effectiveness of corrective actions
Policy Violation Breakdown Chart
The breakdown chart groups violations by category, helping sellers identify the policies creating the greatest compliance risk.
Chart Purpose
- Identify recurring issue categories
- Prioritize remediation activities
- Monitor compliance improvement efforts
- Focus attention on high-impact violations
Order Defect Rate Trend Chart
This historical chart displays changes in order quality and customer satisfaction indicators over time.
Chart Purpose
- Analyze defect trends
- Detect operational problems
- Measure improvement initiatives
- Identify seasonal performance changes
Fulfillment Performance
Fulfillment Performance evaluates the efficiency and reliability of delivery operations through shipping and tracking metrics.
Key Metrics
- On-Time Delivery Rate
- Valid Tracking Rate
How to Improve It
- Optimize warehouse workflows
- Use dependable shipping providers
- Upload tracking information promptly
- Monitor delivery exceptions
- Maintain accurate inventory availability
Chart Purpose
The fulfillment trend chart compares delivery and tracking performance over time, helping identify logistics inefficiencies and bottlenecks.

Customer Sentiment
Customer Sentiment measures customer satisfaction using rating trends, review volume, and overall review activity.
Key Indicators
- Average Customer Rating
- Review Count
- Rating Trends
- Customer Engagement
How to Improve It
- Provide high-quality products
- Deliver excellent customer service
- Resolve issues proactively
- Maintain accurate listings
- Act on customer feedback
Chart Purpose
The chart combines review volume and average ratings to show how customer perception changes over time and whether operational improvements are positively affecting satisfaction.
Using the Dashboard Effectively
Metrics within the dashboard are interconnected. Improvements in compliance, fulfillment, product quality, and customer service can positively influence multiple areas simultaneously. Sellers should regularly review trends, investigate anomalies, and take corrective action before issues impact account standing.