Chart Time Period Comparisons
This document will discuss the types of time period groupings that users commonly want to explore using charts, as well as standard time period comparisons. It will also illustrate how to do all these types of operations using the InetSoft charting features.
Contents
Date Grouping
Date Comparison
Standard Periods
Custom Periods
Comparison Type
Summary


Date Grouping
The most basic time adjustment that users make on a chart is date grouping level, the choice of whether dates are represented at the level of year, quarter, month, week, etc. This is a fundamental requirement simply because data is often meaningful only at a particular level of granularity. For example, for a luxury car manufacturer, sales per hour or sales per day may not be informative, whereas sales per week or month give a better picture of the health of the business. In InetSoft charting, date level can always be easily modified in the Chart Editor, as shown below.
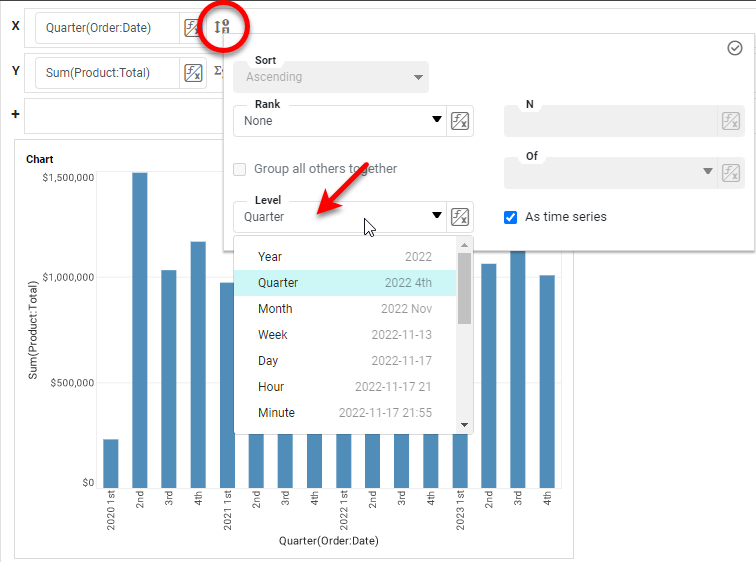
By using the Level property, you can visualize your data at the level of Year, Quarter, Month, Week, Day, Hour, Minute, Quarter of Year, Month of Year, Week of Year, Day of Month, Day of Week, Hour of Day, Minute of Hour, and Second of Minute. Of course you can also choose to display the dates without any grouping at all if desired.
Date Comparison
Business users of dashboards often have the need to compare data across different date ranges, for example:
- Compare this quarter's sales to the previous two quarters
- Compare this January's sales to each of the past five January's sales
- Compare each day last week to each day this week, showing percent change
All of these types of comparisons are very easy to do with the Date Comparison feature in InetSoft charts. Simply press the More (...) button in the top corner of Chart or Crosstab, and select Date Comparison.
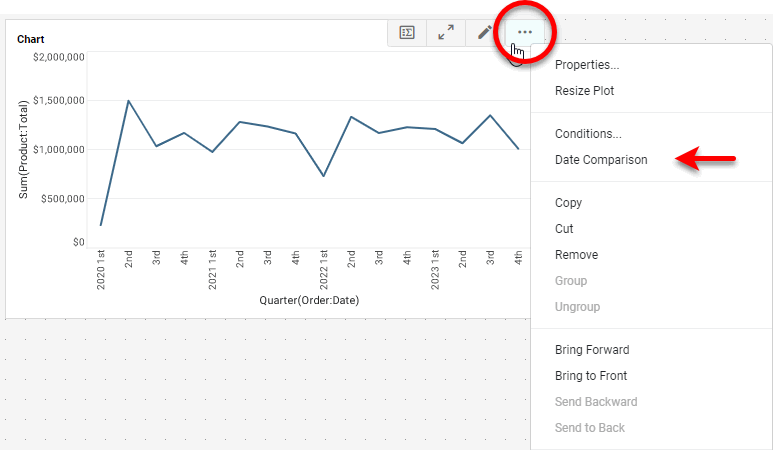
This opens the Date Comparison dialog box, shown below.
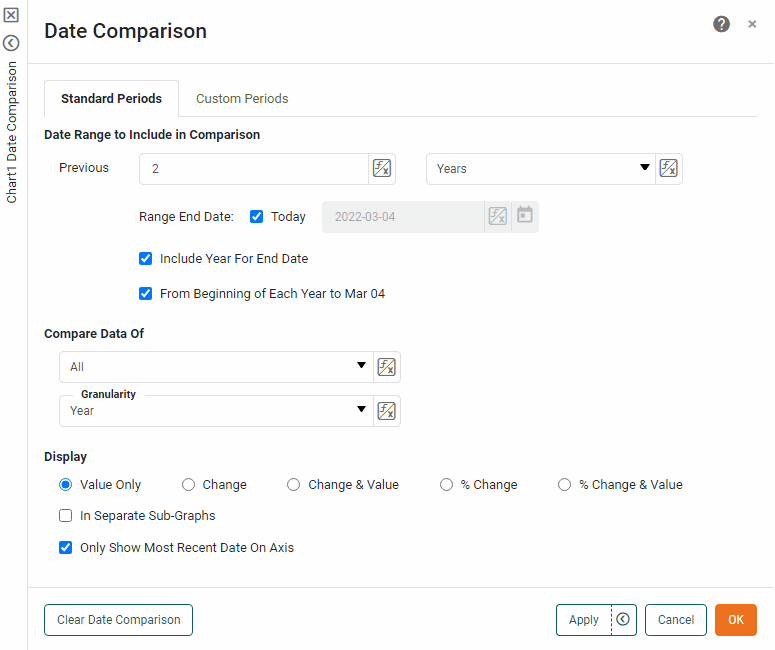
Under Date Range to Include in Comparison, set the span of time to consider in the comparison. You can do this by specifying either a number of previous standard periods to compare (e.g., "compare previous 5 years") or by specifying a set of custom periods to compare (e.g., "compare Jan. 5 through Feb. 10 with Nov. 5 through Dec 10").
Standard Periods
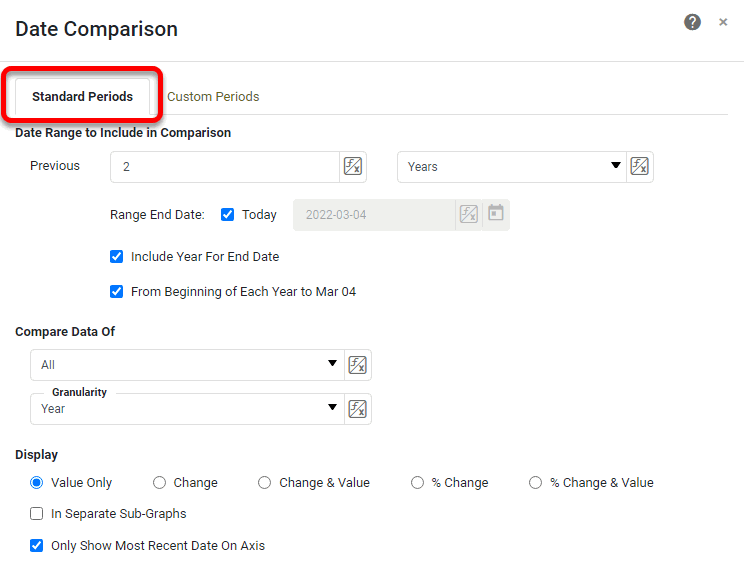
To compare standard periods, select the Standard Periods tab.
Enter the number of past periods to compare and the type of period. For example, enter '4' and select 'Quarter' to compare data from the past four quarters.
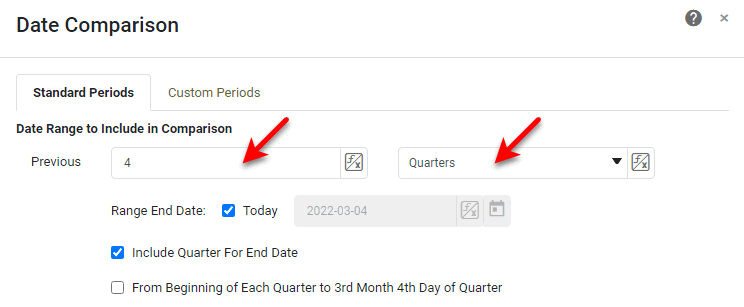
Specify the 'Range End Date'. This is the date that determines the most recent data to include in the comparison. Select 'Today' to use the current date as the cut-off, or deselect 'Today' and enter an arbitrary date as the cut-off. Optional: Select 'From Beginning of Each Year/Quarter/Month/Week to ... of Year/Quarter/Month/Week' to include data only up to the 'Range End Date' (i.e., the same number of days) for all selected periods. For example, if the 'Range End Date' is Jan 21, and you select "previous four quarters" and enable 'From Beginning of Each Quarter to 1st Month 21st Day of Quarter', the current and previous four quarters will each only include the first 20 days of the quarter.
Custom Periods
To compare custom periods, select the Custom Periods tab.
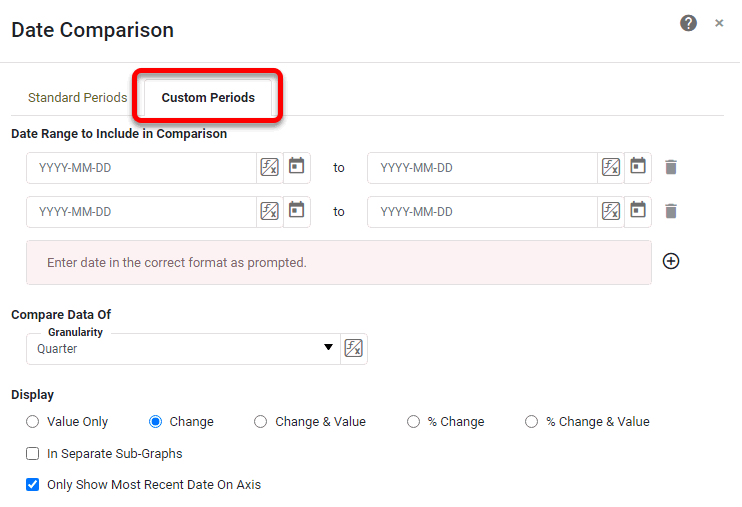
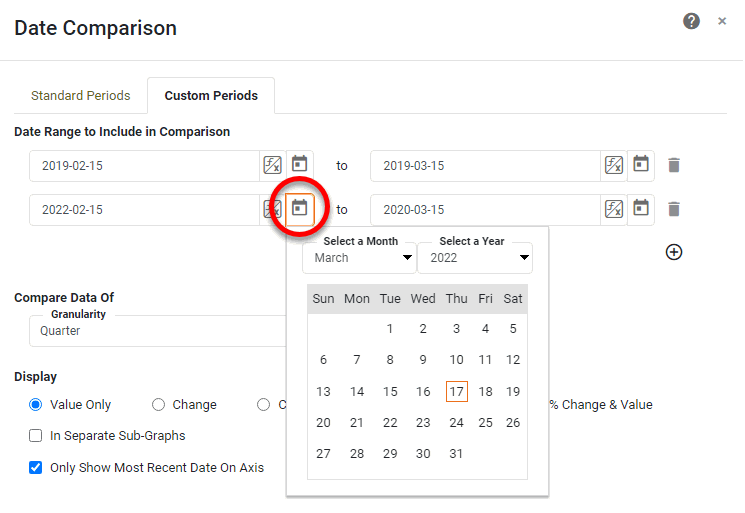
Enter the desired period ranges by typing the dates in the indicated format or by pressing the 'Select a Date' button.
You must specify at least two ranges. To add additional ranges, press the 'Add' button. To remove a range, press the 'Remove' button next to the range.
Comparison Type
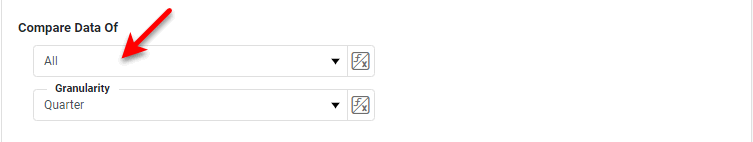
Under Compare Data Of, use the menus to set the desired comparison. To compare all periods within the date range (e.g., all quarters, all months, etc.), select 'All' from the left menu. From the 'Granularity' menu, select the periods that you want to display on the Chart.
An example comparing the past six quarters, broken out by month, is shown below:

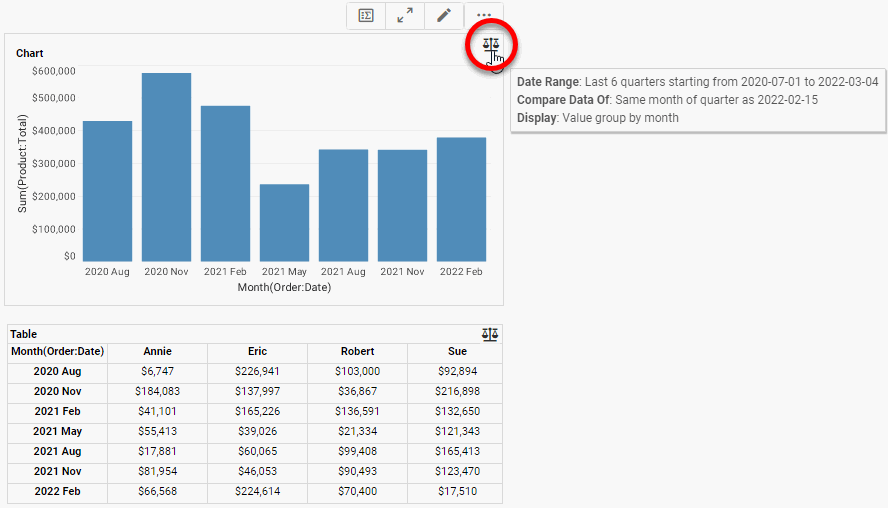
To compare the single same period across the date range (e.g., same month of each year, same week of each quarter, etc.), select 'Same Month', 'Same Week', or 'Same Day' from the left menu. Select 'Use Range End Date' to compare the same month/week/day as the selected 'Range End Date' above, or deselect 'Use Range End Date' and enter an arbitrary date using the calendar widget. From the 'Granularity' menu, select the periods that you want to display on the Chart.
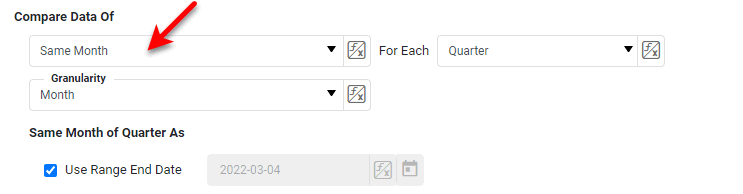
An example comparing the second month of each quarter for the past six quarters is shown below:
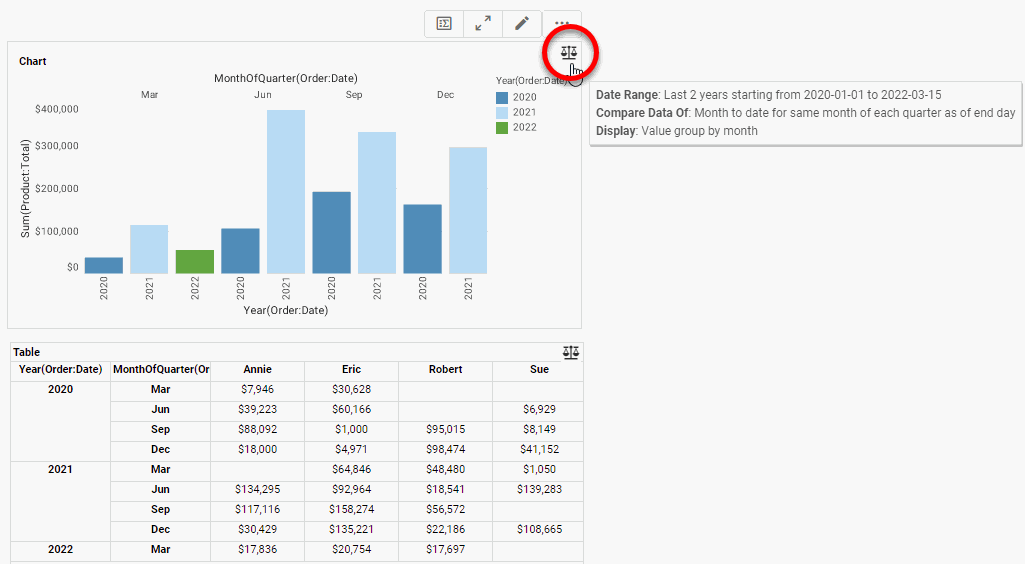
To compare the same period "to date" across the date range (e.g., same month of each year up to the 15th day of the month), select 'Quarter To Date', 'Month To Date', or 'Week To Date' from the left menu. Select 'Use Range End Date' to compare each month/week/day up until the 'Range End Date' date (specified above) within that period (e.g., the 24th day of the quarter), or deselect 'Use Range End Date' and enter an arbitrary date using the calendar widget. Check the 'Inclusive' option to include the specified "as of" date in the range. From the 'Granularity' menu, select the periods that you want to display on the Chart.
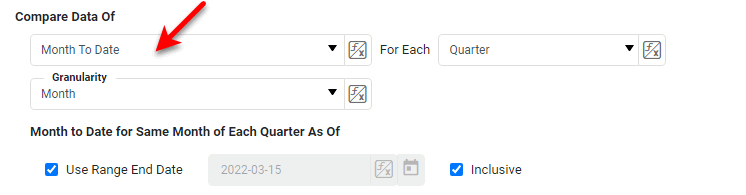
An example comparing month-to-date for each quarter in the past two years is shown below:
Under Display, choose a way to display the comparisons on the Chart: Value displays the aggregated values for all groups on the chart. Change displays the change of each group from the previous group. % Change displays the change of each group from the previous group as a percentage. Change & Value and % Change & Value combine both representations on the Chart.
Summary
The InetSoft Chart date grouping and comparison features are powerful and comprehensive and allow you to compose all of the varieties of date comparisons that are needed to gain crucial insights into your business data.