Evaluate InetSoft's Tools for Developing CIO Dashboards
Are you looking for tools for developing CIO dashboards? InetSoft offers Web-based dashboard software that is easy to use and quick to deploy. Build dashboards to show IT metrics that CIO's care about.
What Is Tracked on a CIO Dashboard?
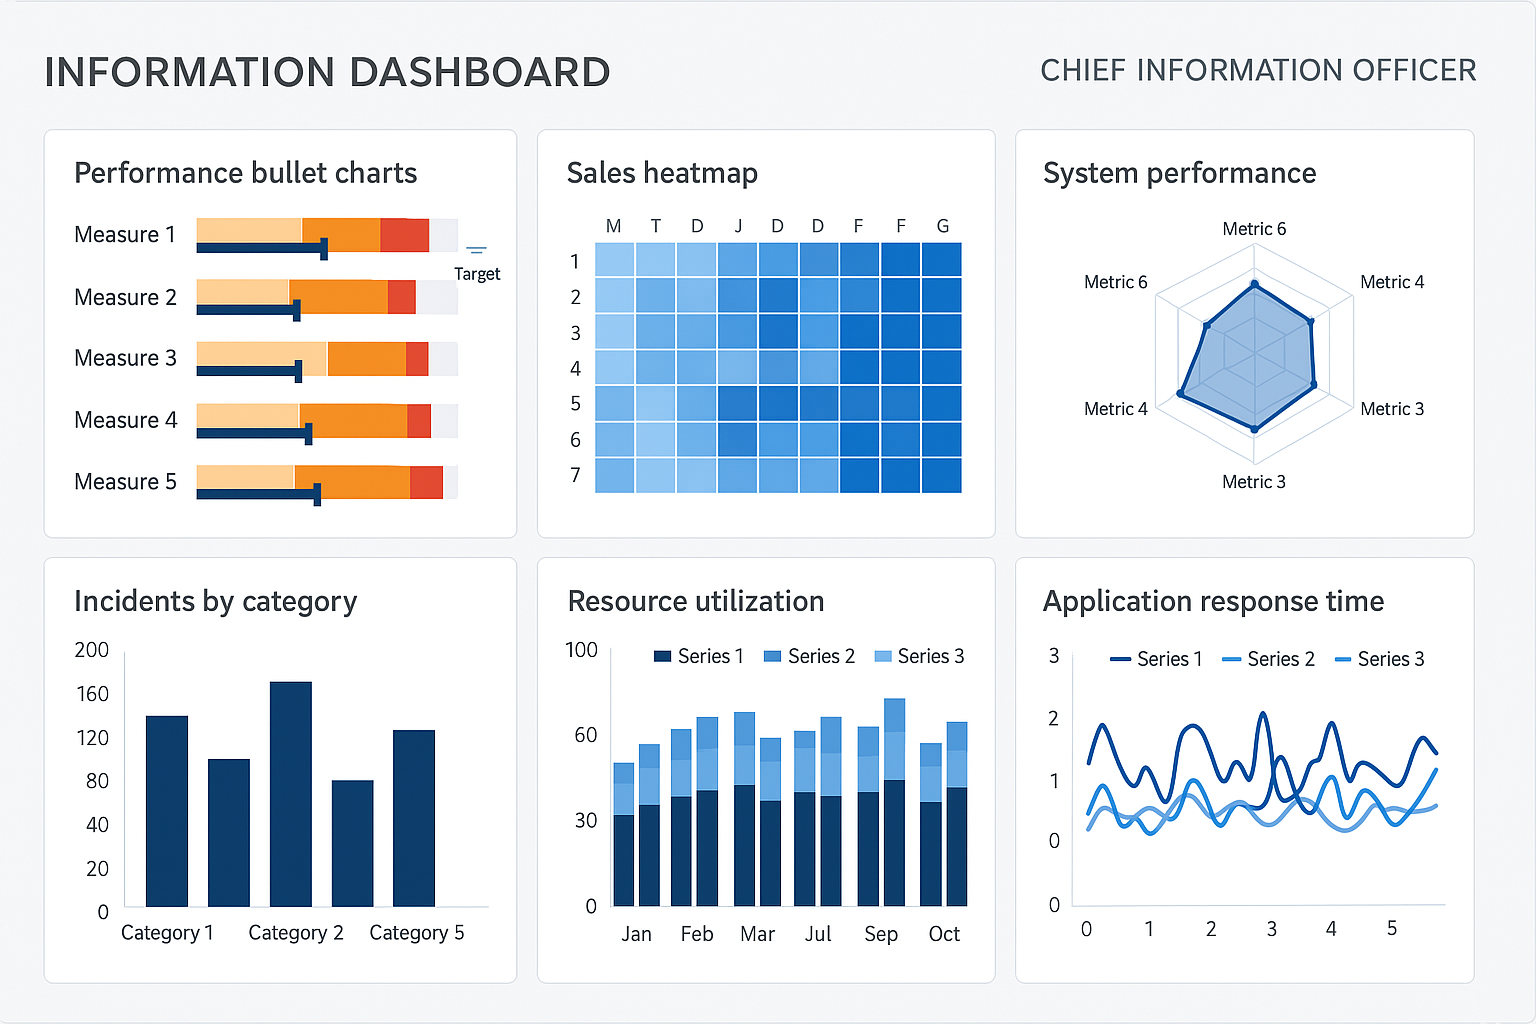
A CIO (Chief Information Officer) dashboard is a strategic tool that consolidates critical metrics across IT operations, business alignment, and digital transformation initiatives. Designed to provide high-level visibility, it helps CIOs make informed decisions, align IT goals with organizational priorities, manage risk, and demonstrate value to stakeholders. A well-designed CIO dashboard merges data from multiple systems, including infrastructure monitoring, service desk platforms, project management tools, financial systems, and business intelligence applications.
1. IT Budget and Spending
One of the most essential components of a CIO dashboard is financial oversight. Key metrics often include actual vs. planned IT budget, operating expenditures (OPEX), capital expenditures (CAPEX), cost per user or department, and cloud spending trends. These figures help CIOs track fiscal discipline, identify budget overruns, and assess ROI on IT investments.
2. Project Portfolio Status
CIOs are often responsible for overseeing a range of technology projects, from infrastructure upgrades to enterprise software deployments. A dashboard typically displays project timelines, completion percentages, budget adherence, risk ratings, and resource allocation. This visibility enables proactive course correction and improved communication with executive teams.
3. IT Service Performance
Operational metrics such as incident response times, service availability, change request resolution, and mean time to repair (MTTR) are vital indicators of IT service effectiveness. CIO dashboards frequently pull data from ITSM tools like ServiceNow or Jira Service Management to display SLA compliance, help desk performance, and user satisfaction ratings (CSAT).
4. Cybersecurity and Risk Metrics
Given the growing importance of cybersecurity, CIO dashboards often include threat detection alerts, patch compliance, phishing attempt volume, and vulnerability scan results. Metrics related to access controls, firewall activity, encryption usage, and intrusion response times help assess the health of the organization’s security posture. CIOs can use this information to guide conversations with CISOs and prioritize remediation efforts.
5. Infrastructure and System Uptime
System availability is central to any CIO’s concerns. Dashboards typically track uptime percentages for key applications and services, server load, network latency, storage utilization, and disaster recovery readiness. These metrics assist in capacity planning and incident prevention, supporting both operational stability and scalability goals.
6. Digital Transformation Progress
Many CIOs lead digital transformation initiatives such as cloud migration, automation, and AI adoption. Dashboards often visualize adoption rates, system integrations, change readiness scores, and usage trends for newly deployed platforms. Tracking these metrics helps demonstrate progress, detect bottlenecks, and validate business impact.
7. Business Alignment Indicators
A strategic CIO dashboard includes metrics that show how well IT aligns with broader business objectives. Examples include IT contribution to revenue-generating initiatives, support for go-to-market strategies, and departmental satisfaction scores. These indicators help CIOs communicate the business value of technology investments in terms familiar to non-technical leadership.
8. Employee Productivity Tools Usage
With the rise of hybrid work, CIOs increasingly monitor collaboration tool usage (e.g., Microsoft Teams, Zoom, Slack), endpoint availability, and VPN access statistics. These metrics help assess digital workplace enablement, spot underused licenses, and guide training needs. They also help CIOs support HR and operations in workforce productivity planning.
9. Compliance and Audit Readiness
For regulated industries, compliance tracking is crucial. CIO dashboards may include metrics related to data retention, GDPR or HIPAA adherence, audit log completeness, and system access review statuses. These indicators help CIOs maintain governance and streamline audits, especially in organizations subject to stringent oversight.
10. Innovation Pipeline
Forward-thinking CIOs track their innovation portfolios on the dashboard, highlighting proof-of-concept initiatives, AI/ML pilots, and partnerships with startups. Metrics such as time-to-innovation, idea throughput, and business sponsor engagement are tracked to measure organizational agility and technical experimentation. This area showcases how the CIO drives future readiness.
More Articles About Dashboards
Dashboard Objects - This section lists objects for for use in interactive dashboards and visual analyses. A Tab element advances the printing to the next tab stop. The Tab element also serves as the superclass of the Text Object. The properties defined in the Tab element are also available in a Text element for controlling the behavior of tabs in the text string. A heading object is a special Text element. Like a regular Text element, a heading object displays a block of text. In addition, a heading object has a heading level, which has two uses: • The heading level determines the heading number (e.g., 1.2, 2.1.1., etc.) that is added to the heading text. • The heading level is used to construct the Table of Contents, if the report contains one. Table elements display tabular data. Tables can flow across pages, or horizontally break between pages. By default, table sizes (including column width and row heights) are automatically calculated based on the cell contents. You can use built-in table styles to control display attributes such as font, color, and alignment. Therefore, a report application normally does not need to specify many table attributes in script...
Dashboard Product as a Collaboration Tool - It seems to me almost to be creating a new segment in our space that these tools that have all of these different features that enables that type of use, are kind of cropping up and creating a new set of value for especially for business users. And I think we have been around this world of BI a long time and we have watched adoption rates slowly creep up. And I think that this type of technology, this ability to explore, have a wider access to information, to kind of site step or jump over IT and all of these things play into this category then along with technologies like In-Memory Analytics and so on, all of them are part of the recipe that enables this to occur. And I see a big trend in that area and I think it’s a powerful trend and a smart one. Well I am a big fan of anything that makes it easier and simpler but still adds power and those seems to be the parts and pieces that are making out that segment right now. The InetSoft server is a collaboration tool. So I can publish this dashboard up to the server...
Dashboard Prototyping Tool - Are you looking for a good dashboard prototyping tool? InetSoft's pioneering dashboard reporting application produces great-looking web-based dashboards with an easy-to-use drag-and-drop designer. Get cloud-flexibility for your deployment. Minimize costs with a small-footprint solution. Maximize self-service for all types of users. No dedicated BI developer required. View a demo and try interactive examples...
Dashboard Registry Directory - Users can set up the dashboard registry directory to draw data from specificied access points for optimal querying capabilities. When you first install StyleBI, the default Registry directory is populated with a number of example data sources, queries, reports, and other assets which are provided for learning purposes. In most cases, when you begin to develop your own reports and assets, you will find it helpful to use a Registry that is not cluttered with these sample materials. It is recommended that you back up files before deleting. To create a clean Registry directory in the existing SREE Home location (WEB-INF/classes), remove all of the files currently in the SREE Home directory, except for the following two essential files: • dbProp.properties (audit database settings) • sree.properties (servlet configuration settings) You may also wish to retain the following files in this directory: dashboard-layouts.xml, which is required for users to construct dashboards, and adhocWizard.xml, which is required for the users to access the Ad Hoc Wizards...
Dashboard Report - Industry analyst report from Dashboard Insight and Lyndsay Wise. Dashboards are quickly becoming the most popular way to quickly and easily monitor company performance. With so many dashboard solutions to choose from, how do you know which is best for your organization. We were actually surprised by its ease–of–use for end–users when we started to see sales managers creating their own dashboards without special training or support from us in IT...


