What Is a Metrics Tree?
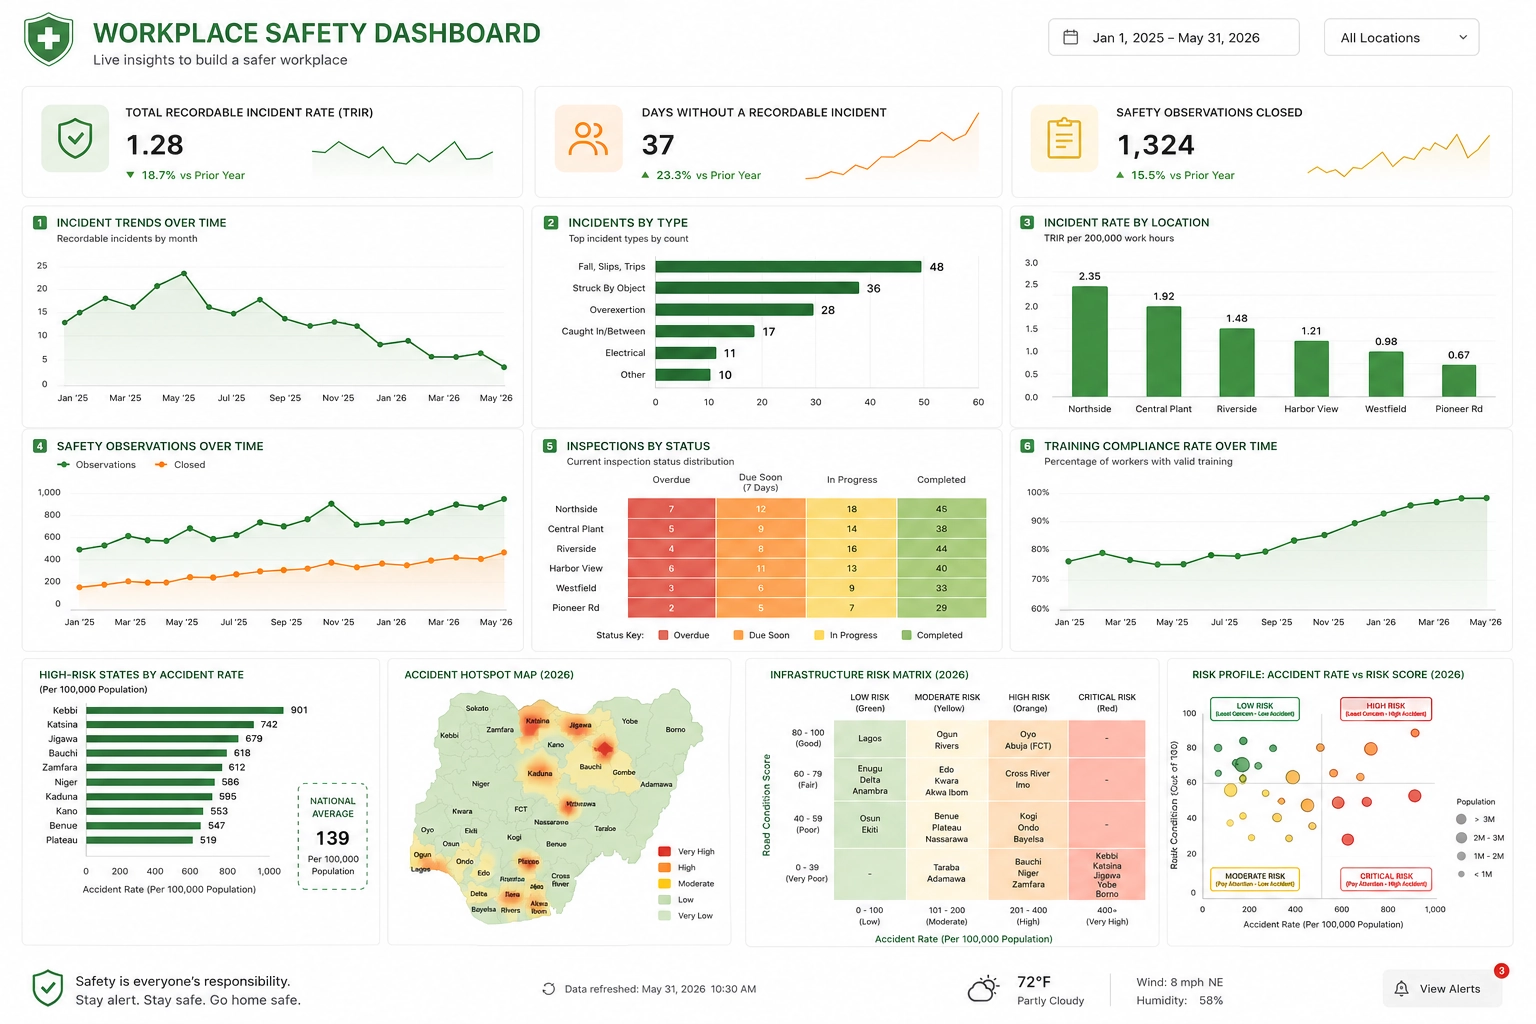
A metrics tree is a visual framework that connects a company's strategic objectives to the key performance indicators (KPIs) and business metrics that influence them.
It organizes metrics in a hierarchy, showing how lower-level operational measurements contribute to higher-level business outcomes.
Organizations use metrics trees to understand cause-and-effect relationships, align teams around shared goals, prioritize improvement efforts, and identify which metrics have the greatest impact on success.
Metrics trees are commonly used in business intelligence, product management, SaaS operations, marketing analytics, finance, and executive dashboard reporting.

What Is a Metrics Tree?
A metrics tree starts with a top-level business objective and breaks it into the metrics that influence that objective. Each level in the tree answers the question:
"What factors drive this metric?"
For example, a software company may place Monthly Recurring Revenue (MRR) at the top of the tree. MRR can then be broken into components such as:
- New customer revenue
- Expansion revenue
- Renewal revenue
- Customer churn
Those metrics can then be further decomposed into operational measurements such as qualified leads, conversion rates, onboarding completion rates, customer retention, and product adoption.
The result is a clear map showing how individual business activities contribute to organizational success.
Why Are Metrics Trees Important?
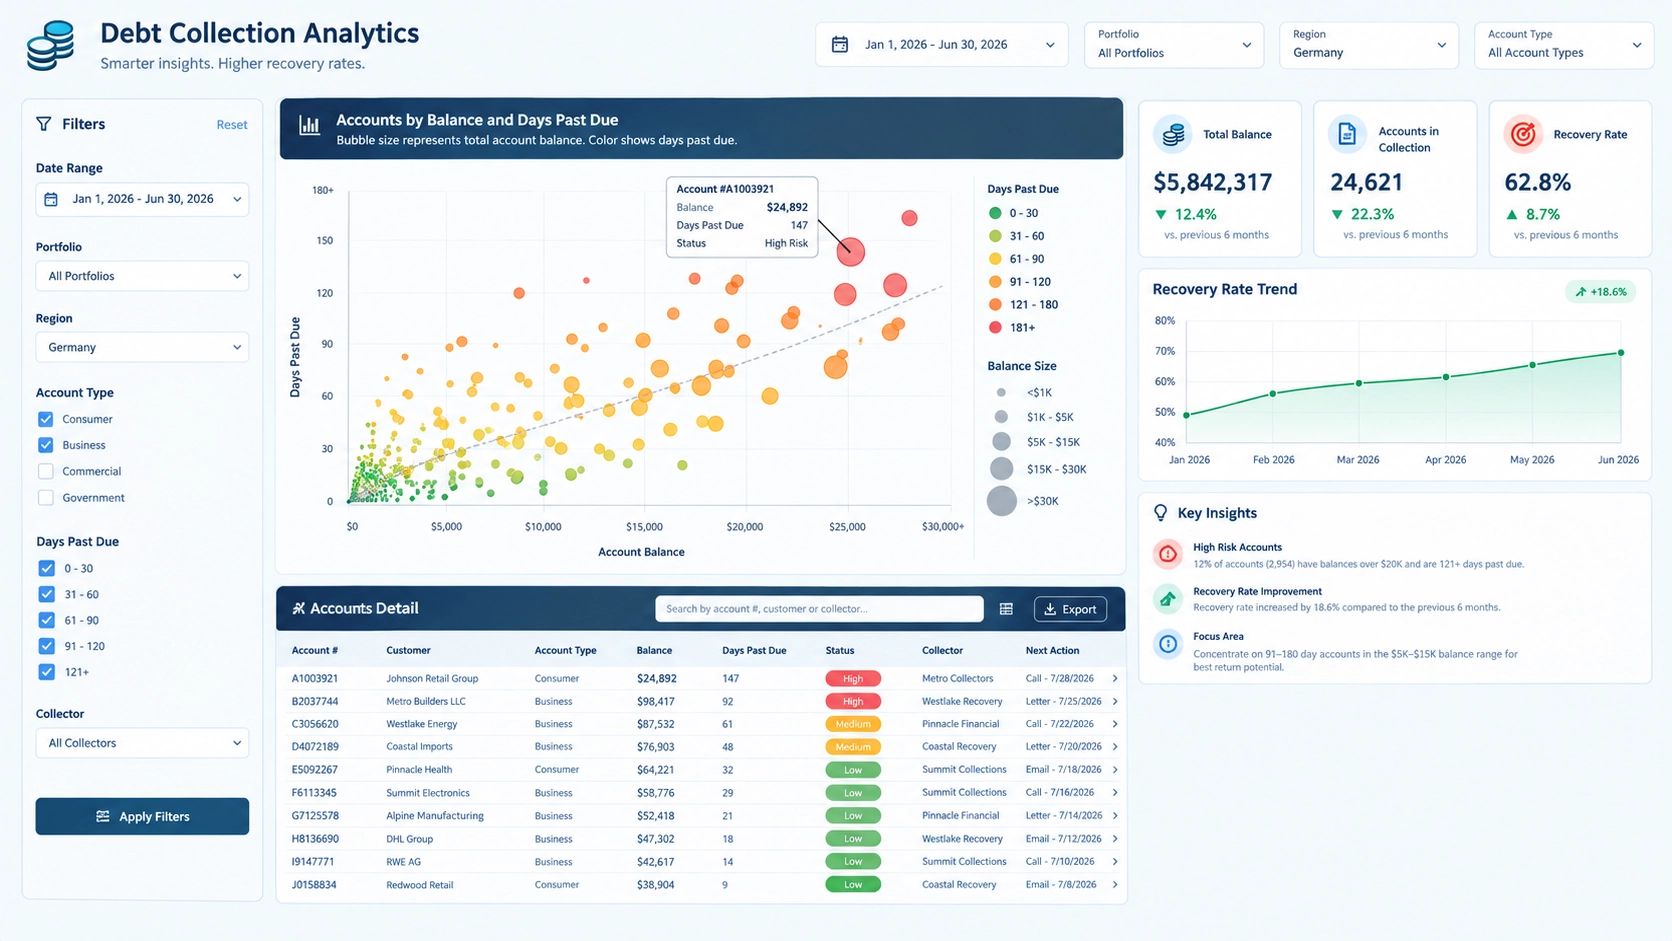
Organizations often track hundreds of KPIs. Without a framework that shows how these metrics connect, teams may focus on measurements that have little impact on strategic objectives.
Metrics trees provide:
- Alignment between business strategy and execution
- Greater visibility into performance drivers
- Improved KPI prioritization
- More effective dashboard design
- Faster root-cause analysis
- Better cross-functional collaboration
- Stronger accountability for measurable outcomes
Instead of monitoring metrics in isolation, organizations gain a comprehensive understanding of how metrics interact across departments.
Key Components of a Metrics Tree
North Star Metric
At the top of the tree is a strategic business outcome such as revenue, profitability, customer retention, customer satisfaction, or user engagement.
Driver Metrics
These are metrics that directly influence the top-level objective and explain changes in performance.
Operational Metrics
Operational measurements track the activities and processes performed by teams throughout the organization.
Leading Indicators
Leading indicators provide early warning signs and help predict future performance.
Supporting KPIs
These detailed measurements allow teams to monitor specific business processes and improvement efforts.
Metrics Tree Example
A retail company focused on increasing revenue may create a metrics tree like the following:
Total Revenue
|
+-- Number of Orders
|   |
|   +-- Website Visitors
|   +-- Conversion Rate
|
+-- Average Order Value
    |
    +-- Product Mix
    +-- Upsell Rate
    +-- Cross-Sell Rate
This structure helps executives determine whether revenue growth is being driven by customer acquisition, conversion improvements, pricing changes, or purchasing behavior.
Metrics Tree vs. KPI Dashboard
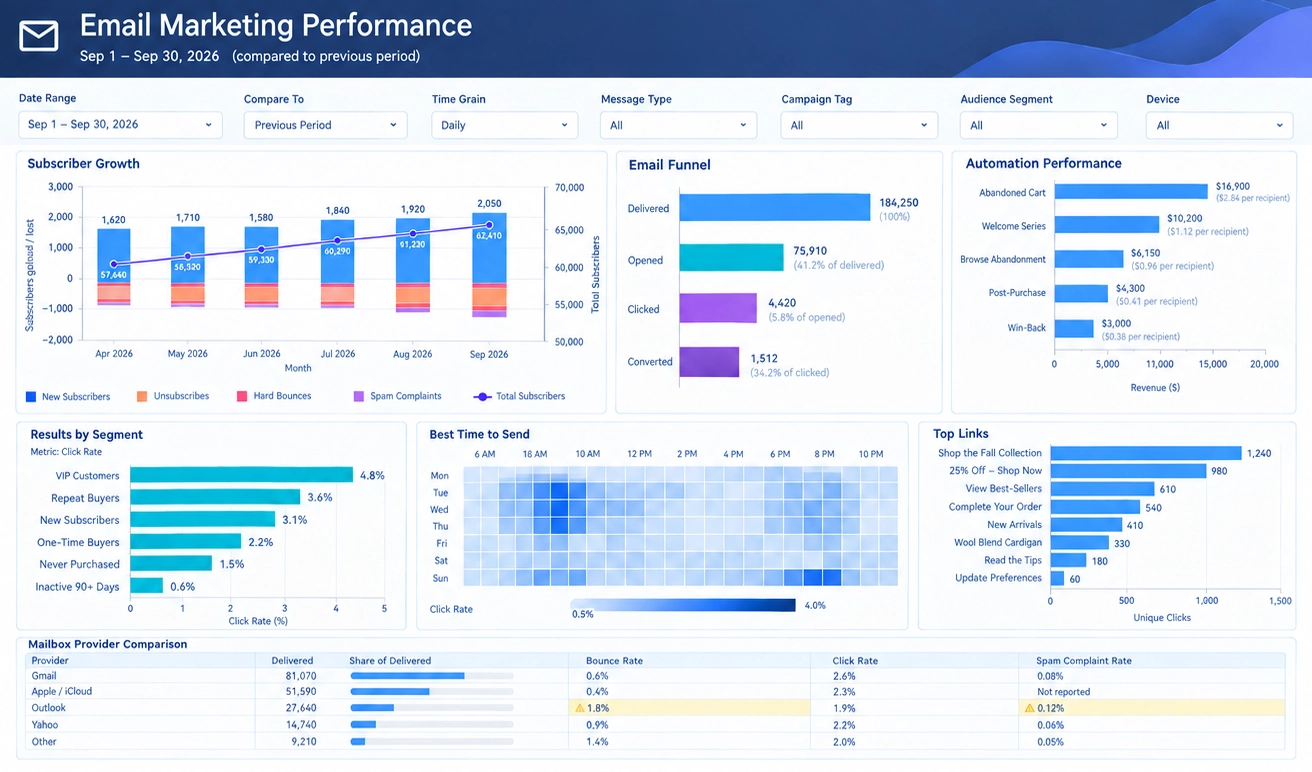
Although metrics trees and KPI dashboards work together, they serve different purposes.
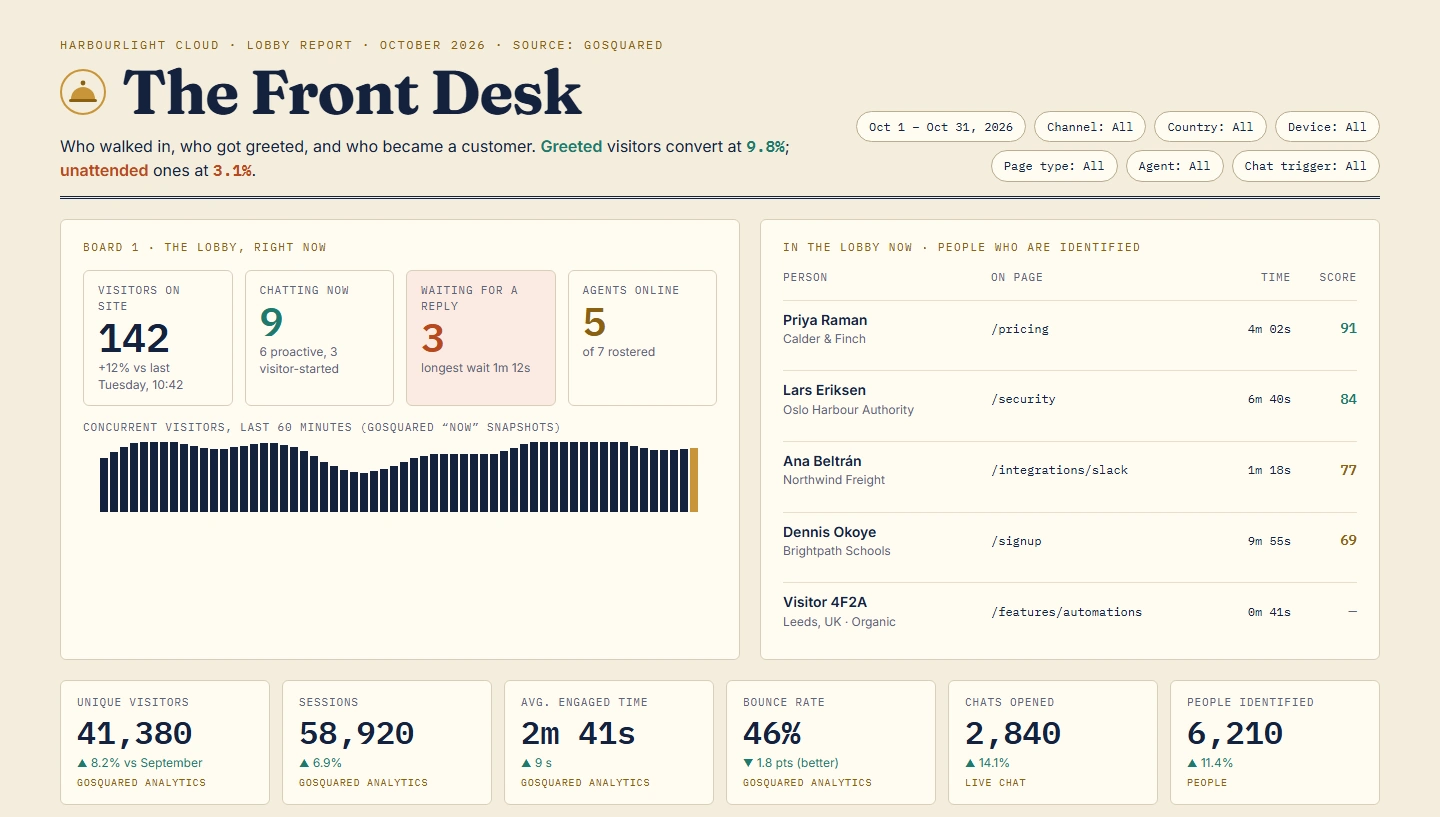
A metrics tree defines what should be measured, while dashboards track those measurements and present them visually for ongoing monitoring.
How Do You Build a Metrics Tree?
- Define the primary business objective.
- Select the main success metric.
- Identify factors that directly influence that metric.
- Break those factors into measurable KPIs.
- Assign ownership for each metric.
- Validate relationships using business data.
- Create dashboards to track performance.
- Review and refine the tree regularly.
The best metrics trees focus on meaningful business drivers while remaining simple enough for stakeholders to understand.
Metrics Trees and Business Intelligence
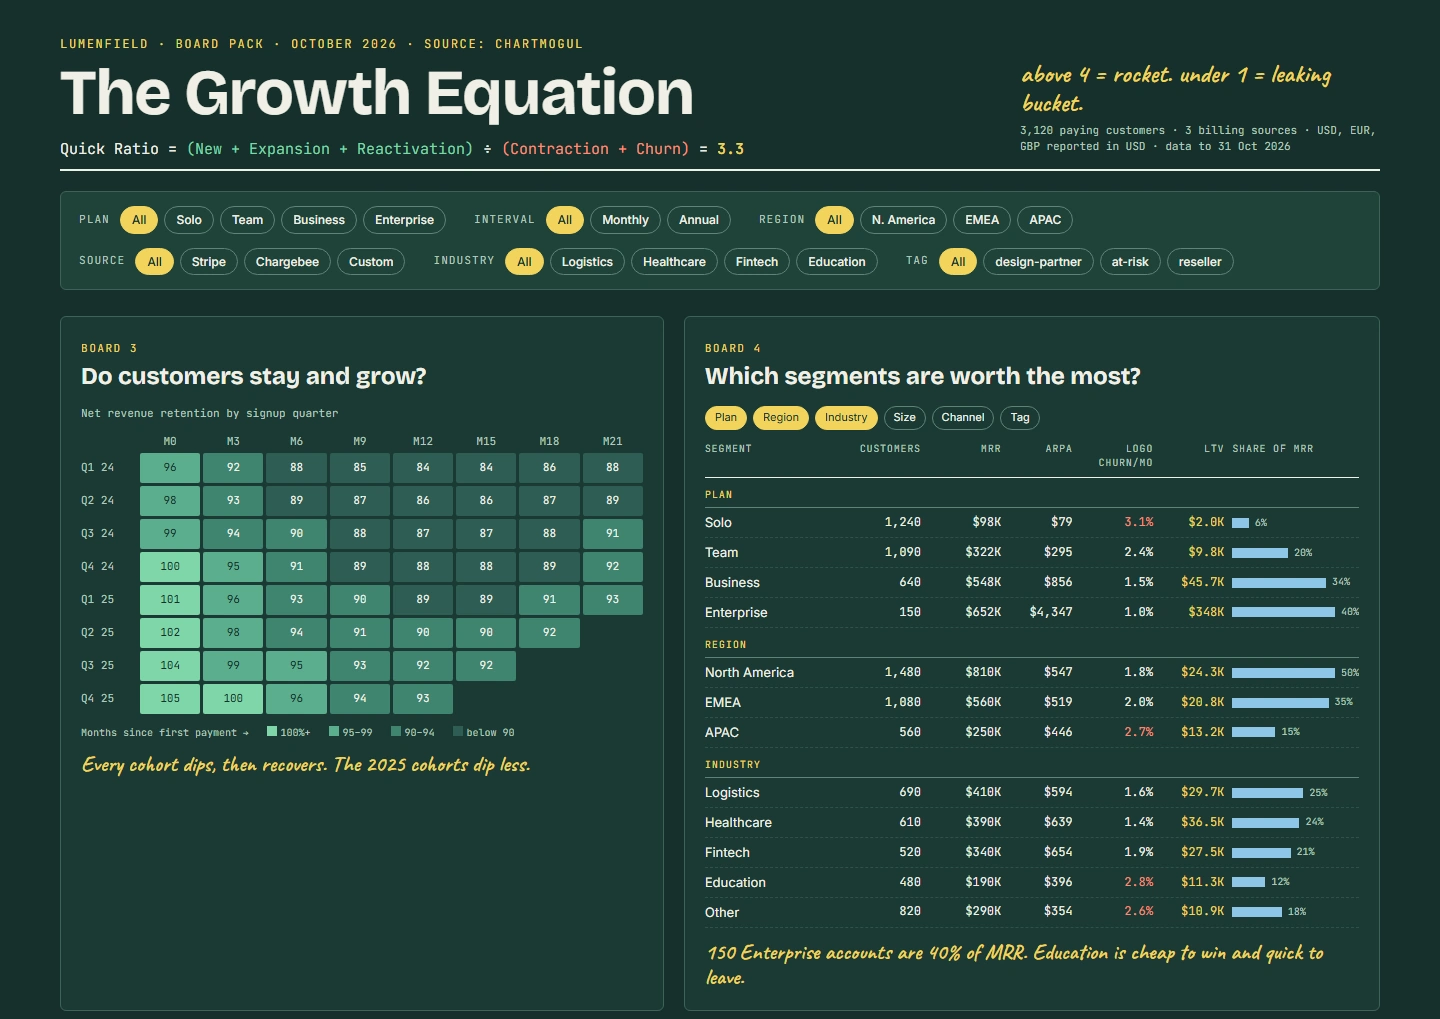
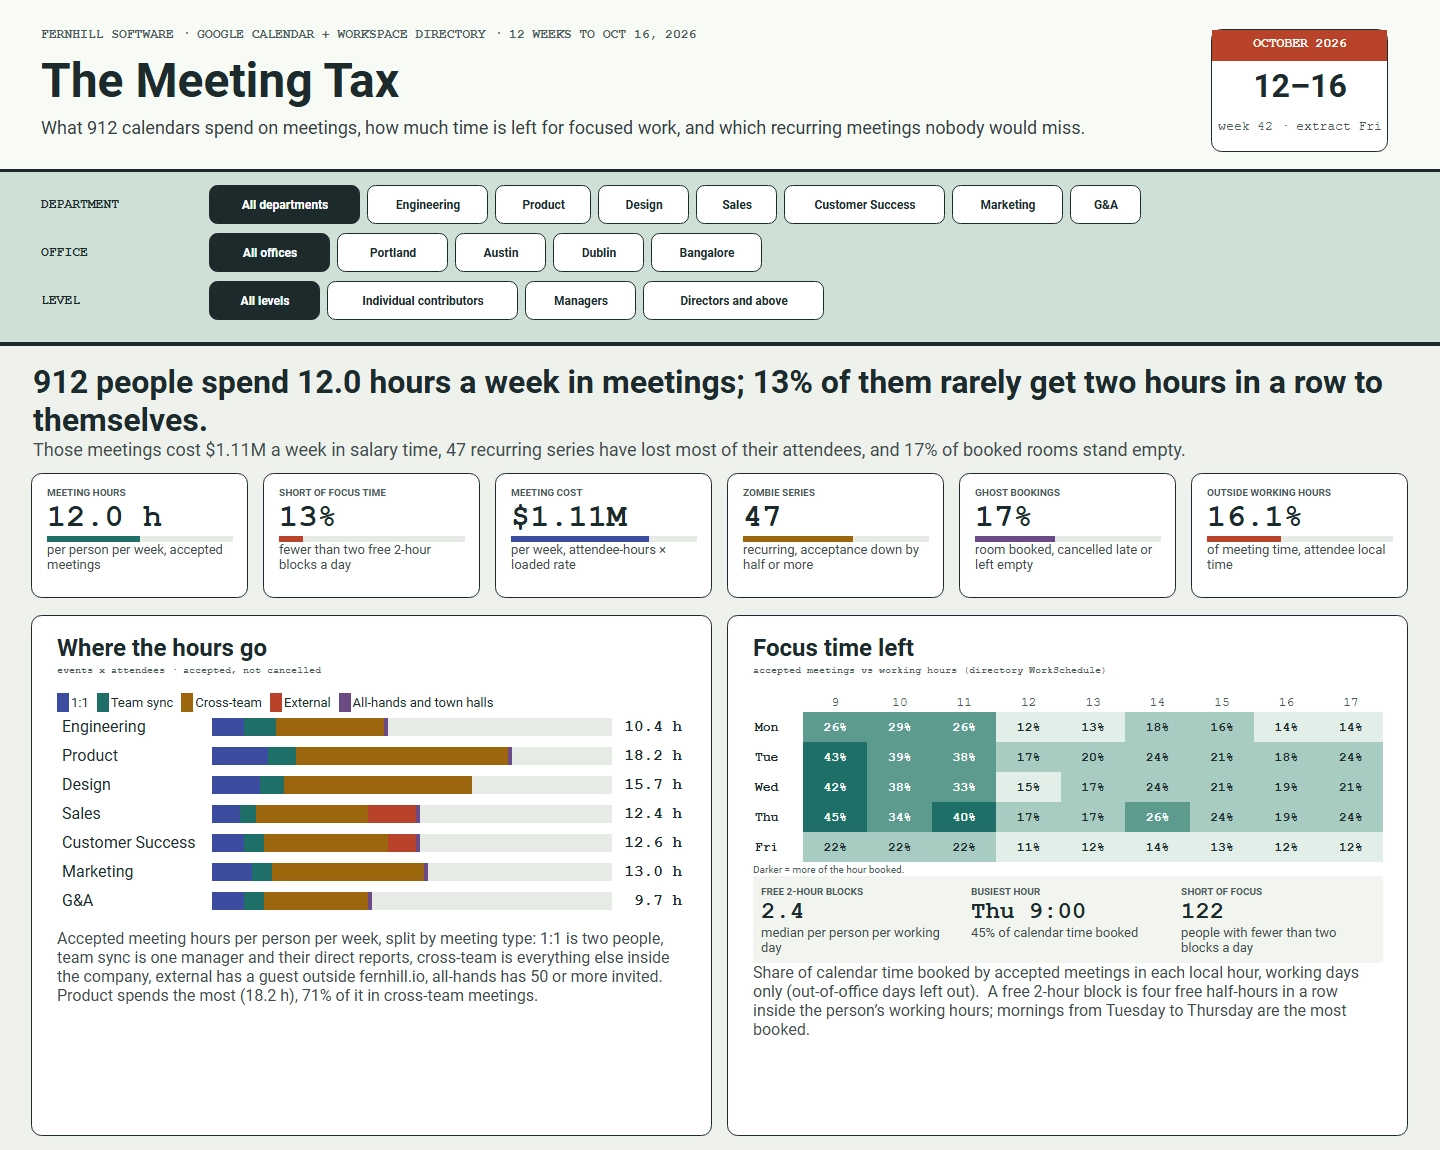
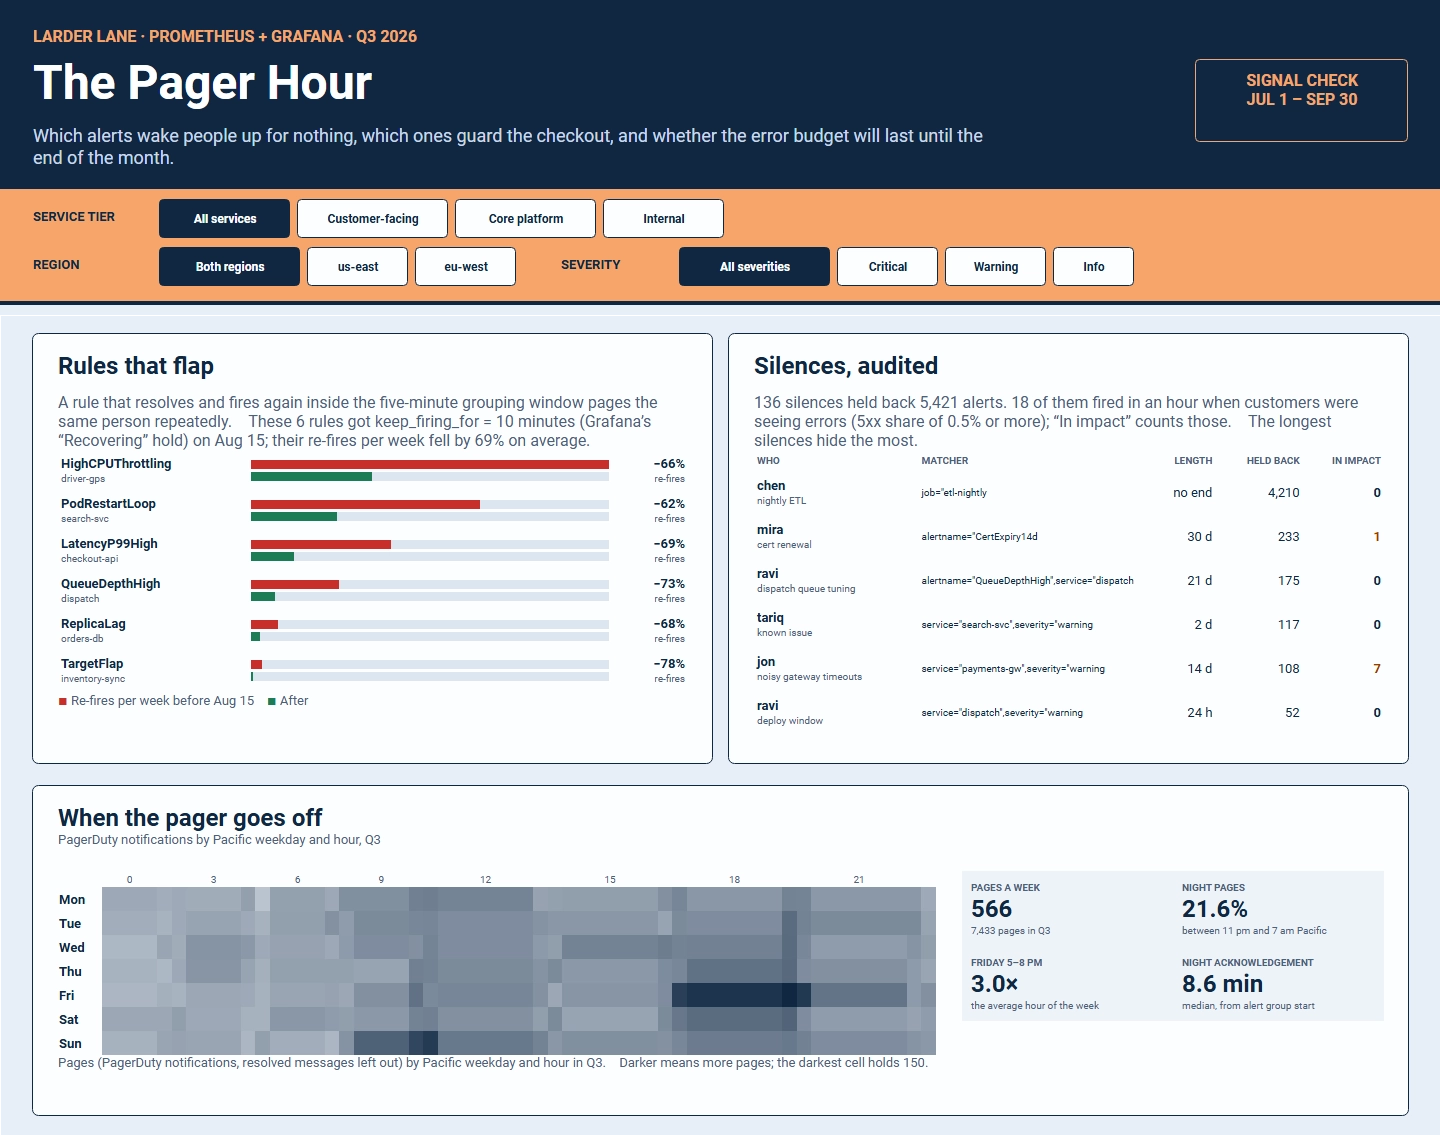
Modern business intelligence platforms help organizations operationalize metrics trees by connecting data sources, calculating KPIs, and delivering interactive dashboards.
With business intelligence software, users can:
- Track metrics at every level of the hierarchy
- Perform drill-down analysis
- Analyze trends and anomalies
- Create KPI alerts and notifications
- Conduct root-cause investigations
- Share insights across teams
Combining a metrics tree with a business intelligence platform helps transform reporting into proactive performance management.
Metrics Tree Best Practices
- Start with clear business objectives.
- Focus on outcomes instead of vanity metrics.
- Limit the number of top-level goals.
- Use both leading and lagging indicators.
- Review metric definitions regularly.
- Assign ownership to every KPI.
- Align dashboards with the metrics hierarchy.
- Continuously validate metric relationships with data.
Conclusion
A metrics tree is a powerful framework for understanding how operational activities contribute to strategic business results. By organizing metrics into a hierarchy of interconnected drivers and outcomes, organizations gain a clearer view of performance, improve decision-making, and create more effective dashboard reporting. When paired with modern business intelligence tools, metrics trees provide a practical roadmap for measuring, managing, and improving business performance.
Frequently Asked Questions
What is a metrics tree?
A metrics tree is a hierarchical framework that connects strategic objectives to the metrics and KPIs that influence them.
What is the purpose of a metrics tree?
Its purpose is to show how operational metrics contribute to business outcomes, helping organizations align efforts and improve decision-making.
How is a metrics tree different from a KPI dashboard?
A metrics tree explains relationships between metrics, while a KPI dashboard displays performance results and trends.
What is a North Star metric?
A North Star metric is the primary success metric that often appears at the top of a metrics tree and represents the organization's strategic objective.
Who uses metrics trees?
Metrics trees are used by executives, business analysts, finance teams, product managers, marketers, and business intelligence professionals.
Can metrics trees improve dashboard design?
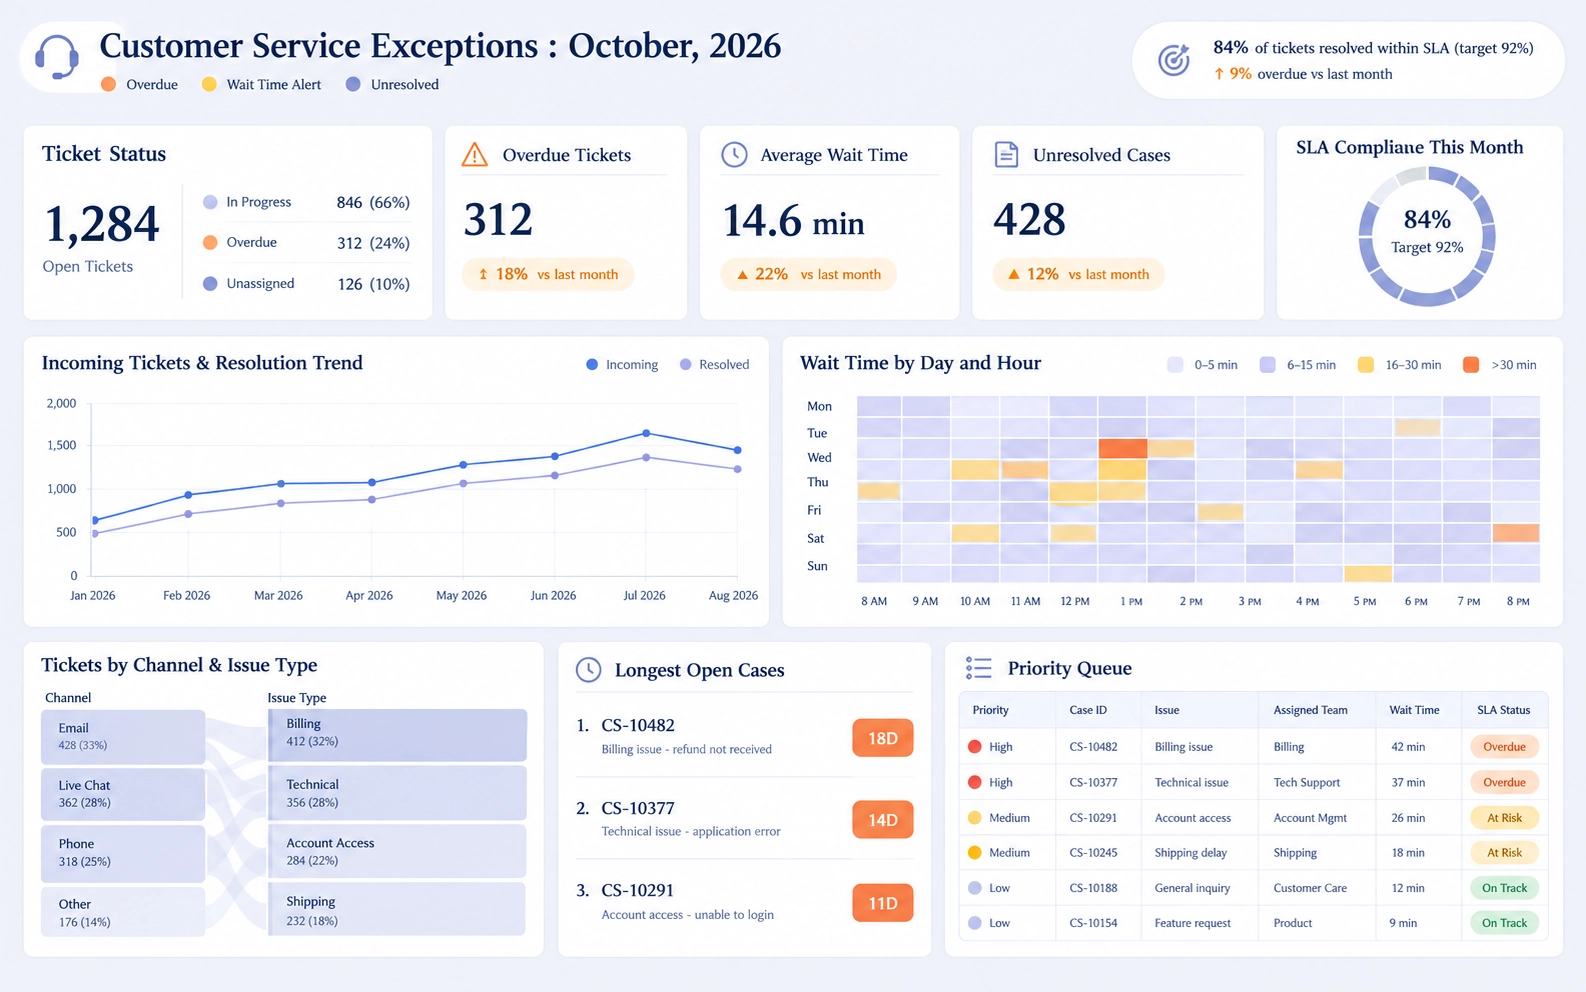
Yes. Metrics trees help organizations identify which KPIs should appear on dashboards and how those KPIs relate to broader business goals.