MRR Dashboards
A Monthly Recurring Revenue (MRR) dashboard is a business intelligence tool used by subscription-based companies to monitor recurring revenue performance, customer retention, churn, expansion revenue, subscription growth, billing health, and renewal risk. By combining financial, customer, and operational metrics into a single view, organizations can quickly understand whether recurring revenue is growing sustainably or leaking through cancellations, failed payments, and downgrades.
The example shown in "The Renewal Ledger" presents a complete SaaS subscription analytics dashboard designed for executives, finance teams, revenue operations managers, customer success leaders, and subscription billing administrators. The dashboard follows the entire customer lifecycle, from acquisition and trial conversion to renewal, expansion, failed payment recovery, and customer churn.
Dashboard Overview
The dashboard provides a centralized subscription performance scorecard. Users can filter data by plan type, billing frequency, geographic region, acquisition channel, and customer cohort. These filters allow revenue teams to identify trends across specific market segments and subscription groups.
At the top of the dashboard, high-level KPIs summarize business performance and provide an immediate snapshot of recurring revenue health.
- Total Monthly Recurring Revenue (MRR)
- Annual Recurring Revenue (ARR)
- Net New MRR
- Net Revenue Retention (NRR)
- Logo Churn Rate
- Failed Payment Recovery Rate
- Average Revenue Per Account (ARPA)
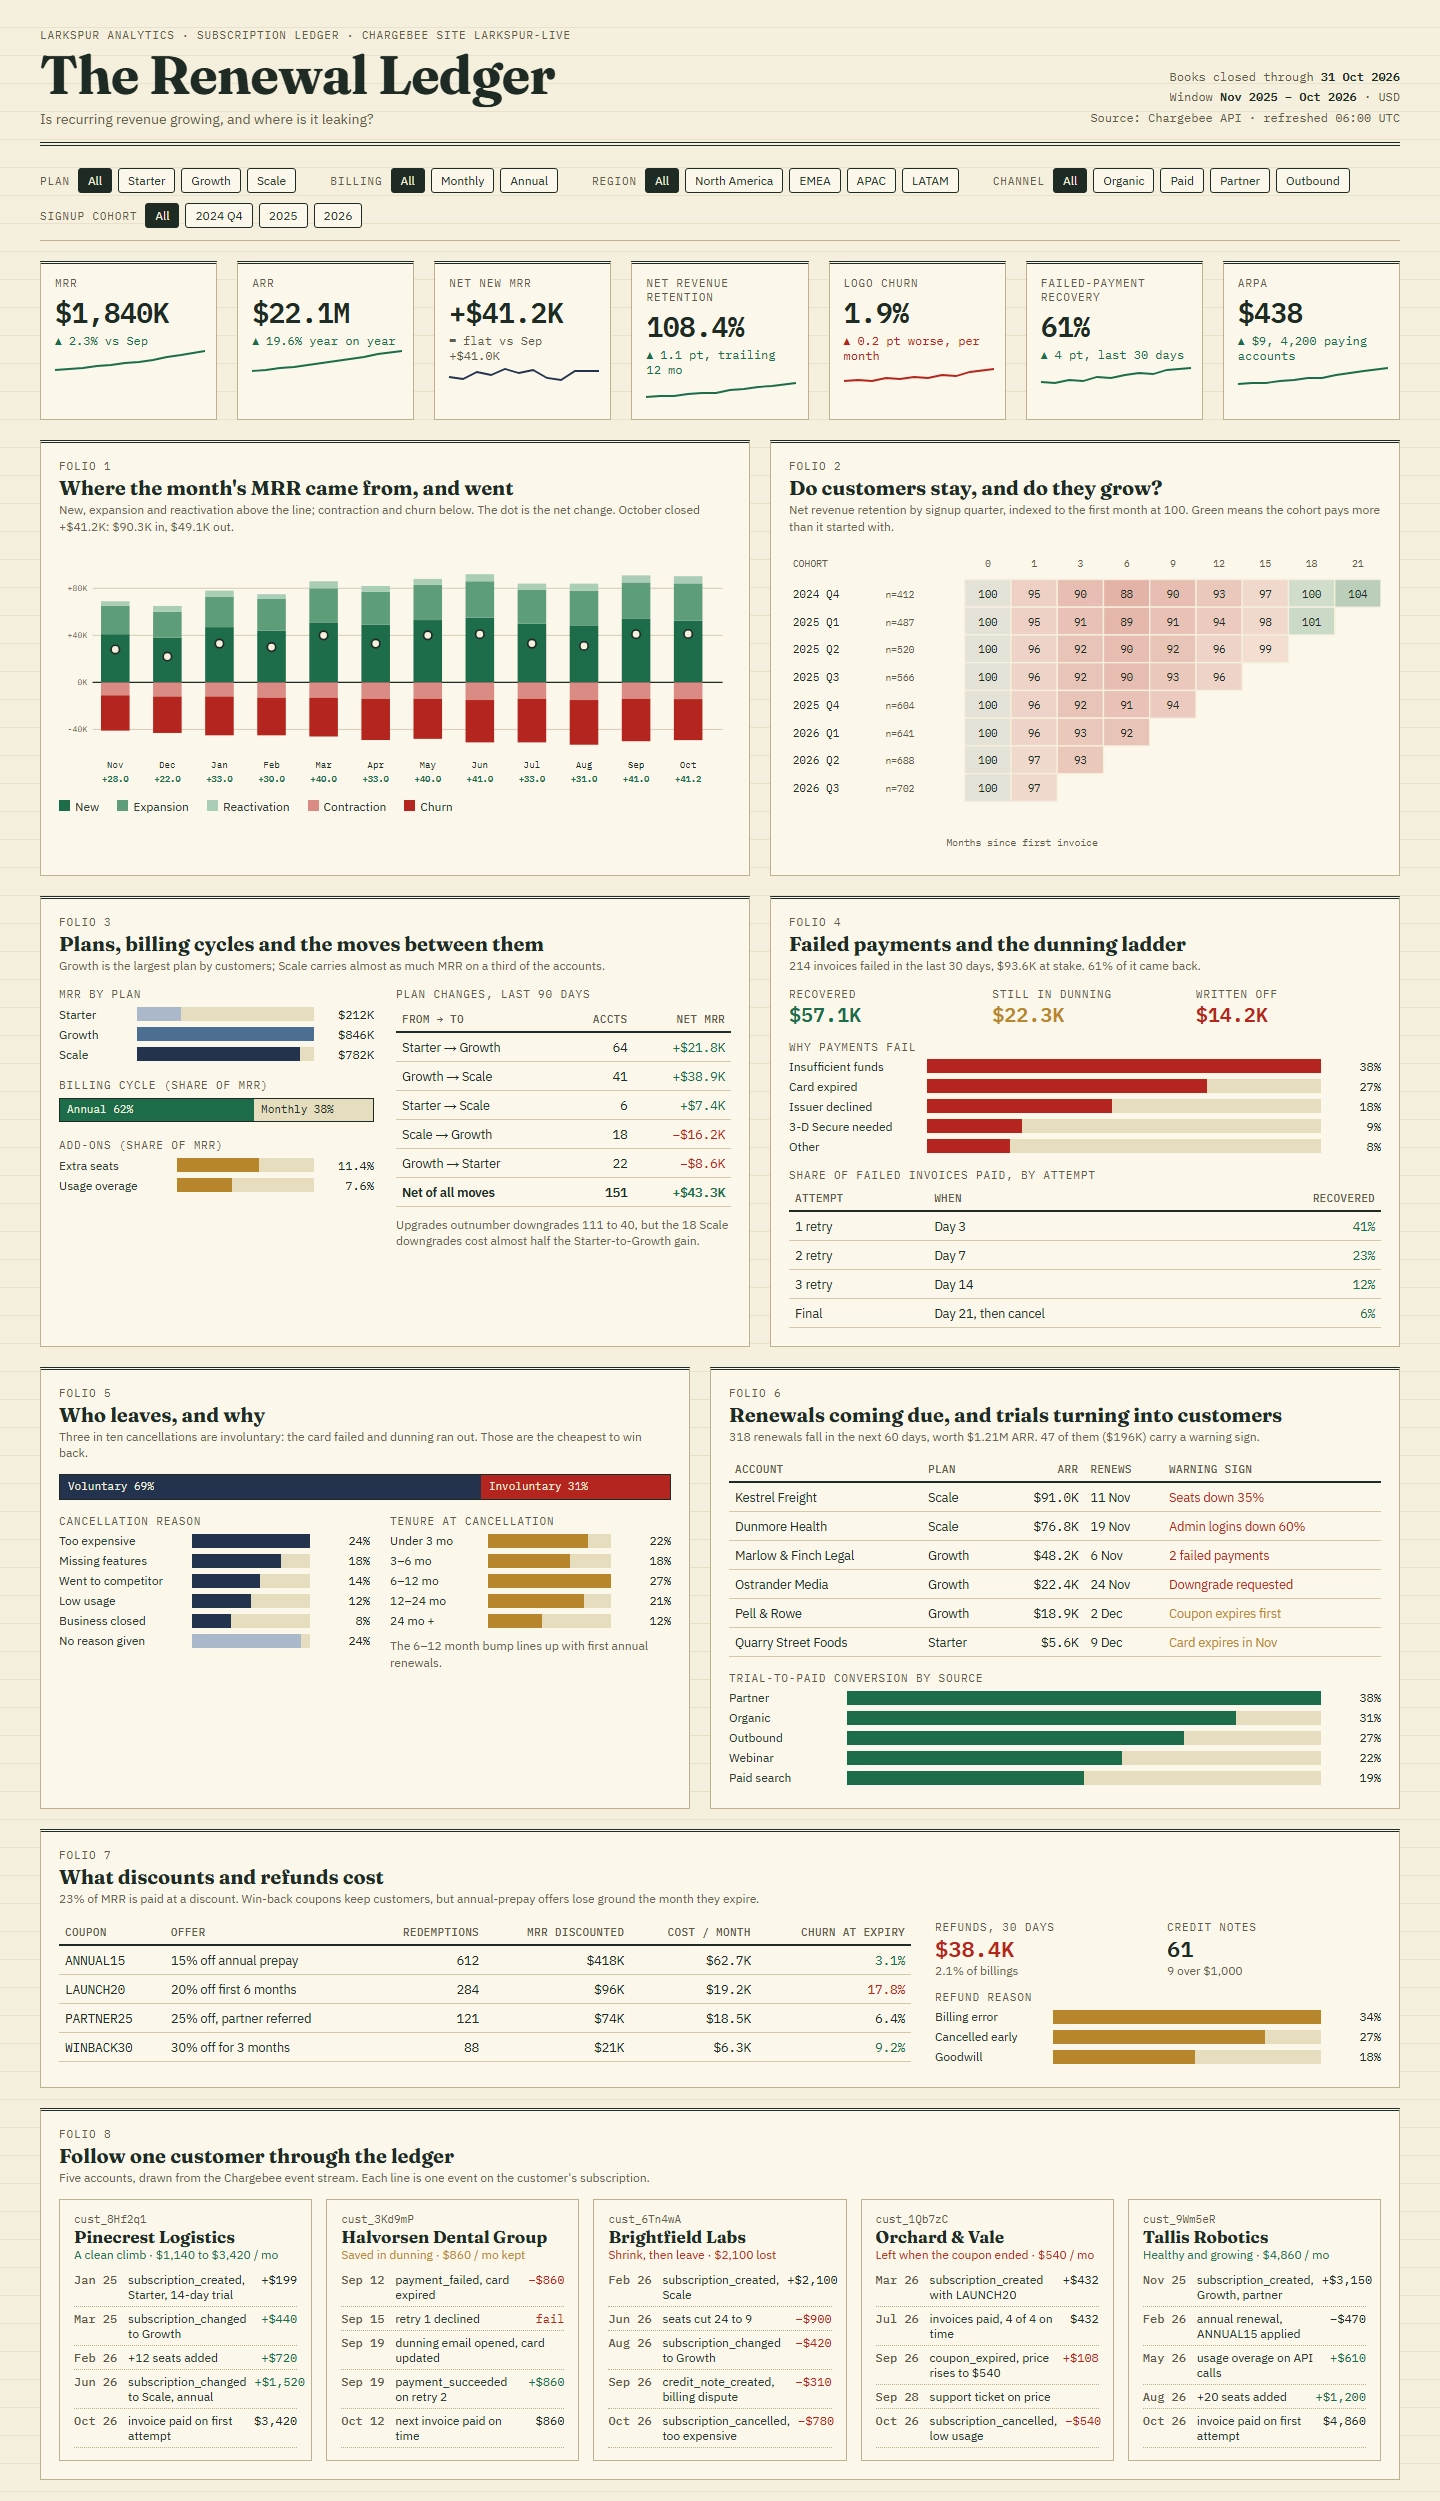

Where the Month's MRR Came From and Went
One of the most important visualizations is the MRR movement analysis. This chart breaks monthly revenue activity into major components:
- New customer revenue
- Expansion revenue
- Reactivation revenue
- Contraction revenue
- Customer churn
The visualization functions similarly to an MRR waterfall chart, helping management understand exactly how recurring revenue changed from one month to the next. Positive contributions appear above the baseline while revenue losses appear below it. The net change indicator shows whether growth exceeds revenue leakage.
This analysis helps answer questions such as:
- Are expansion sales driving growth?
- Is new customer acquisition slowing?
- How much revenue is being lost to churn?
- Are customer downgrades increasing?

Customer Retention and Cohort Growth
A customer cohort retention matrix provides insight into long-term customer value. Customers are grouped by signup date and then tracked over subsequent months to determine how revenue changes over time.
This type of analysis allows organizations to determine:
- Whether customer cohorts remain active
- Which cohorts expand spending after onboarding
- How retention varies by acquisition period
- Whether product improvements increase customer lifetime value
Net Revenue Retention is a critical SaaS metric because it measures the combined effects of retention, expansion, contraction, and churn. Strong NRR indicates customers continue generating more revenue over time.
Subscription Plan Performance
Revenue leaders need visibility into which subscription plans contribute most to growth. The dashboard compares Starter, Growth, and Scale plans and measures each plan's contribution to total recurring revenue.
Additional analysis highlights customer movement between plans, including:
- Starter to Growth upgrades
- Growth to Scale upgrades
- Scale downgrades
- Plan migrations over time
Tracking these transitions helps product and customer success teams identify upgrade opportunities and understand the customer journey.

Failed Payment Recovery Monitoring
Failed payments represent one of the largest sources of avoidable revenue loss in subscription businesses. The dashboard includes a dedicated section for billing recovery analysis.
Organizations can monitor:
- Total recovered revenue
- Outstanding balances
- Written-off invoices
- Recovery performance by retry attempt
- Primary reasons for payment failure
This analysis supports dunning management initiatives designed to improve collections and reduce involuntary churn.
Customer Churn Analysis
Understanding why customers leave is essential for reducing recurring revenue loss. The churn section separates voluntary cancellations from involuntary churn events and categorizes the reasons customers terminate subscriptions.
Common churn categories include:
- Missing features
- Competitive alternatives
- Low product usage
- Business closure
- Payment failures
- Cost concerns
The dashboard also analyzes customer tenure at cancellation, helping companies identify critical risk periods during the subscription lifecycle.

Renewal Pipeline and Risk Management
Future revenue visibility is critical for subscription forecasting. The renewal management section highlights upcoming contract renewals, renewal value, warning indicators, and customer-specific risk factors.
Account managers can proactively engage customers before renewal dates and address issues before recurring revenue is lost.
Examples of renewal alerts include:
- Low product adoption
- Payment issues
- Declining usage trends
- Contract expiration dates
- Customer support concerns
Discount and Refund Analysis
Discounting strategies can boost customer acquisition but may also reduce recurring revenue and profitability. The dashboard tracks coupon programs, promotional offers, refunds, credit notes, and churn associated with discounted subscriptions.
Key questions answered include:
- Which promotions produce the highest ROI?
- Do discounts increase churn at renewal?
- How much MRR is affected by discounts?
- What percentage of billings are refunded?

Customer Lifecycle Tracking
The final section follows individual customers across their subscription journey. Billing events, plan changes, upgrades, payment recoveries, support interactions, and cancellations are presented chronologically.
This customer ledger view allows revenue teams to understand exactly how customer actions affect recurring revenue over time and provides valuable context when investigating growth opportunities or churn events.
Business Benefits of an MRR Dashboard
- Monitor recurring revenue growth in real time
- Reduce customer churn
- Improve renewal forecasting accuracy
- Increase expansion revenue visibility
- Track subscription plan performance
- Recover failed payments more effectively
- Measure customer retention trends
- Optimize discount and promotion strategies
- Improve customer lifetime value
- Support executive revenue planning

The Operational Command Center
An MRR dashboard serves as the operational command center for subscription businesses. By consolidating recurring revenue metrics, churn analysis, cohort retention, billing recovery, renewals, customer lifecycle tracking, and plan performance into a single interface, organizations gain the visibility needed to grow recurring revenue while minimizing leakage. A comprehensive dashboard like The Renewal Ledger enables data-driven decisions that improve customer retention, optimize revenue operations, and increase long-term subscription profitability.