What Is an Operational Early Warning Dashboard?
An Operational Early Warning Dashboard is a business intelligence dashboard that monitors critical operational metrics and alerts decision-makers to emerging issues before they become major business problems. Instead of simply reporting what has already happened, an early warning dashboard helps organizations identify negative trends, threshold violations, and operational risks in time to take corrective action.
These dashboards act as an organization's radar system, continuously tracking key performance indicators (KPIs), service levels, process bottlenecks, quality metrics, and operational anomalies across departments and business functions.
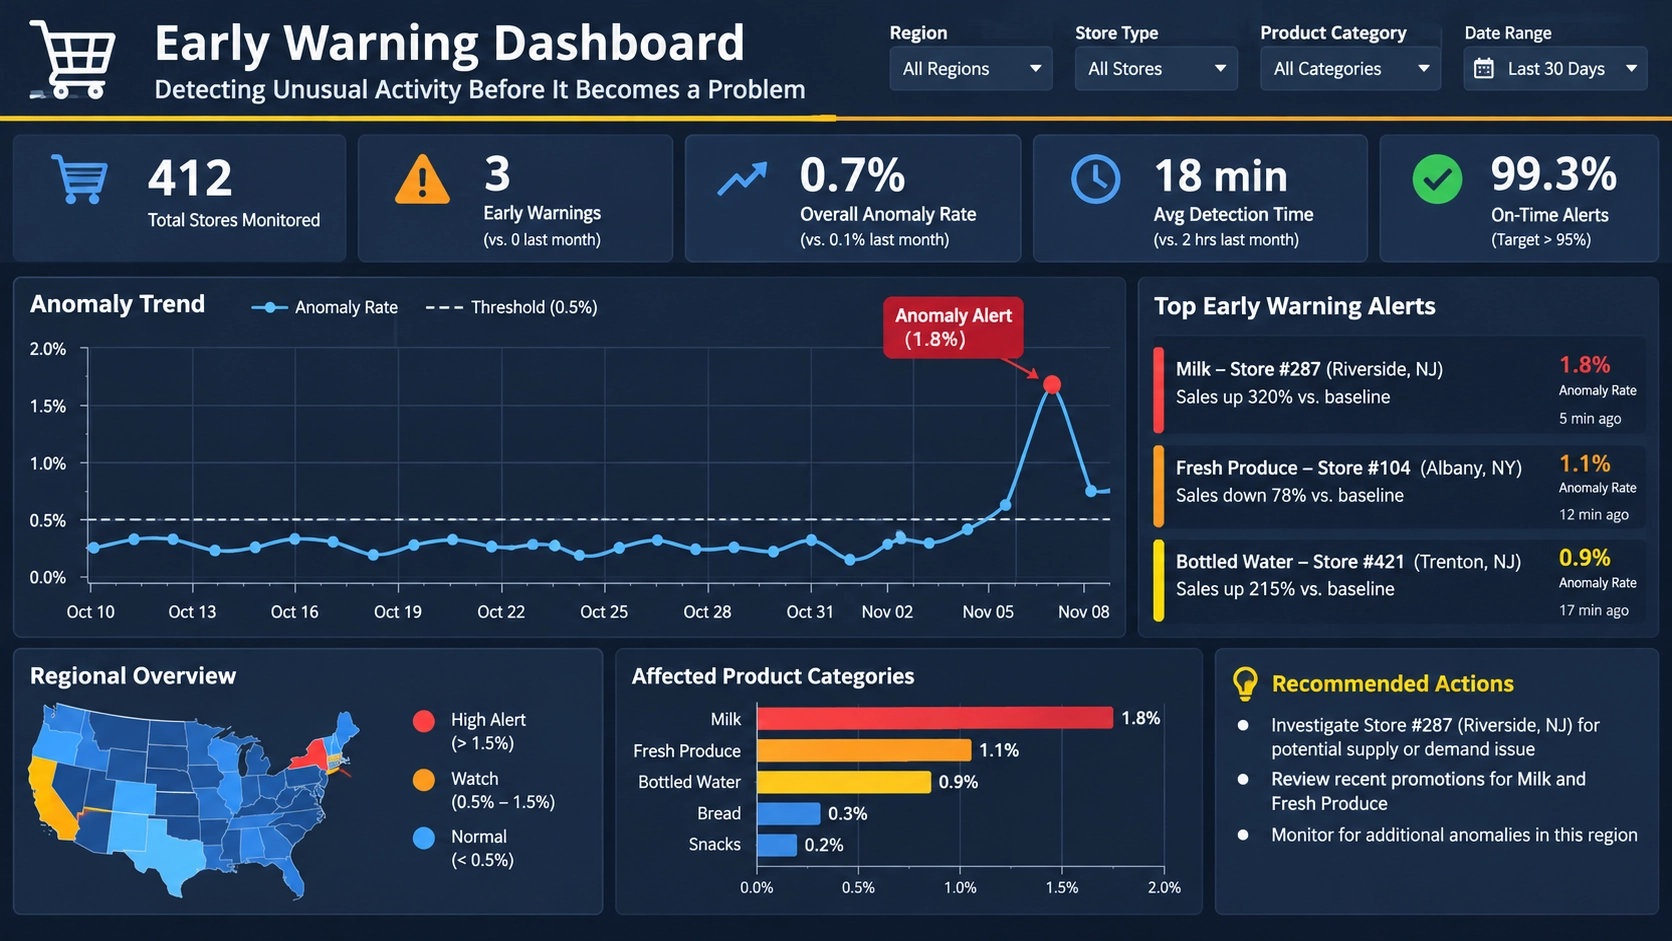

How an Operational Early Warning Dashboard Works
Traditional dashboards often focus on historical performance reporting. An operational early warning dashboard goes further by emphasizing indicators that signal future performance risks.
The dashboard continuously analyzes incoming operational data and compares metrics against expected performance levels, thresholds, historical trends, and forecasting models.
When unusual patterns emerge, the dashboard highlights potential risks through alerts, visual indicators, exception reporting, and automated notifications.
This allows managers to intervene before operational disruptions lead to customer dissatisfaction, revenue losses, compliance breaches, or increased costs.
Examples of Early Warning Indicators
Effective dashboards focus on leading indicators rather than waiting for lagging indicators to reveal a problem.
- Declining production throughput
- Increasing equipment downtime
- Growing order backlogs
- Rising customer support ticket volume
- Falling inventory availability
- Increasing employee absenteeism
- Declining service-level agreement compliance
- Rising defect or error rates
- Longer order fulfillment cycles
- Unexpected cost increases
These metrics often provide advance notice of operational issues before they impact larger business outcomes.
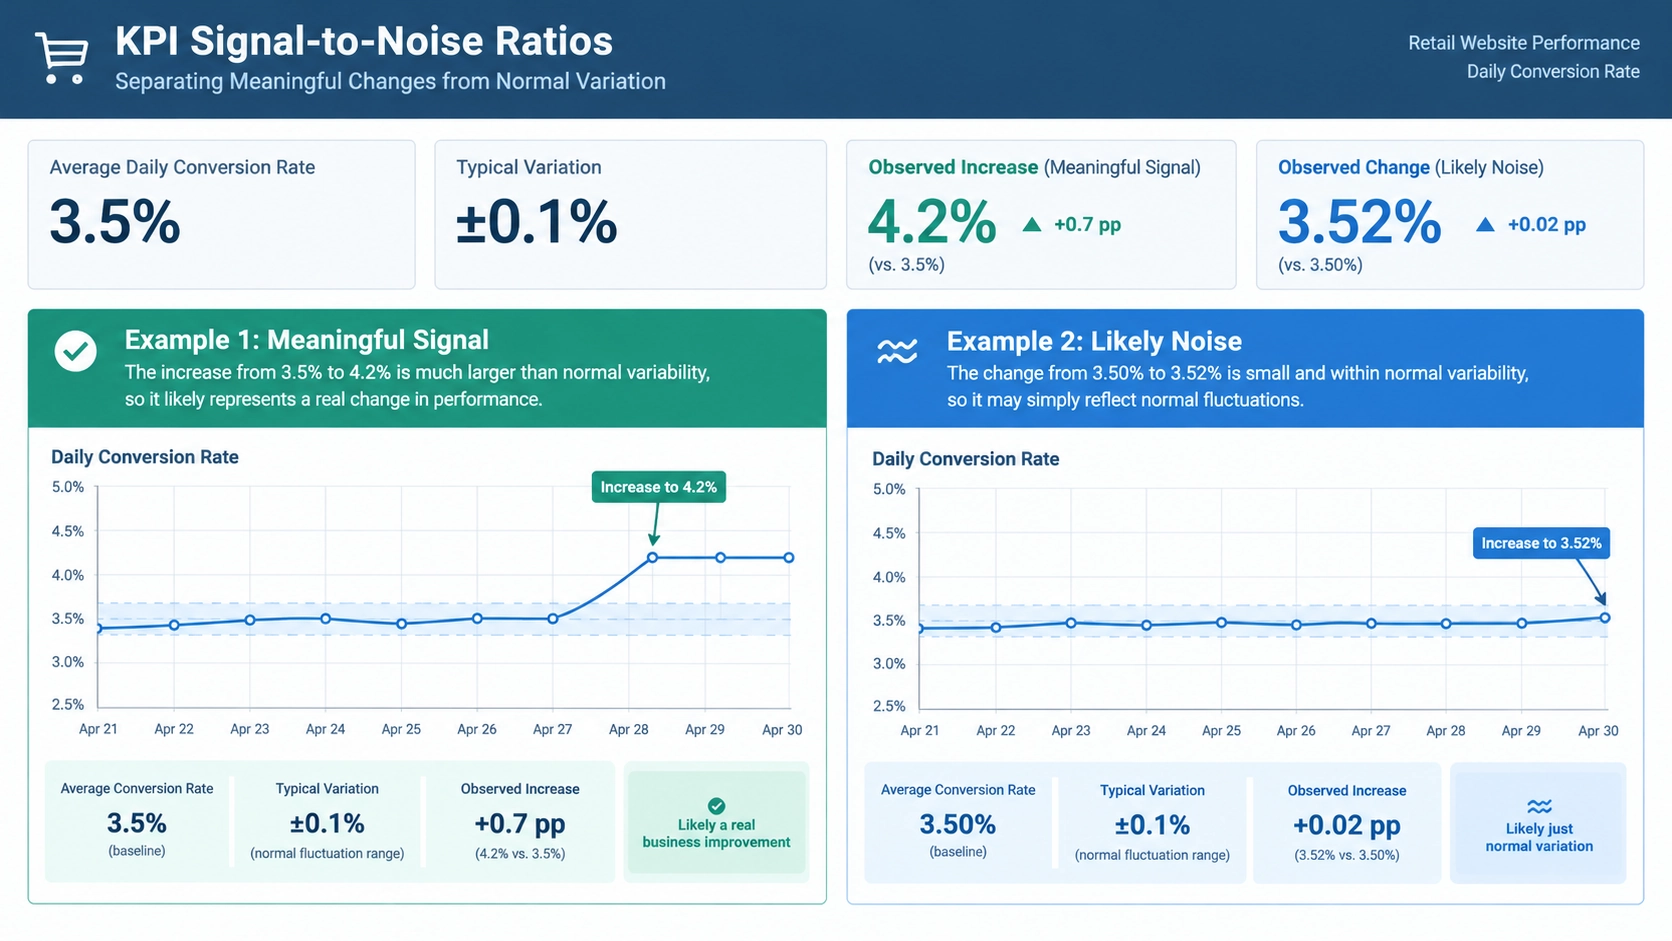
Key Components of an Early Warning Dashboard
Threshold Monitoring
Thresholds establish acceptable performance ranges. Metrics that move outside these ranges automatically receive attention through color-coded alerts and exception indicators.
Trend Analysis
Trend monitoring identifies gradual performance deterioration that may not yet have crossed formal KPI thresholds but still signals future risk.
Exception Reporting
Exception reporting helps users focus on unusual conditions rather than reviewing hundreds of routine metrics.
Root Cause Drill-Down
Interactive dashboards allow users to investigate warning signals by examining underlying departments, locations, products, teams, or processes.
Alert Notifications
Automated alerts ensure that stakeholders receive timely notification when critical conditions require immediate attention.
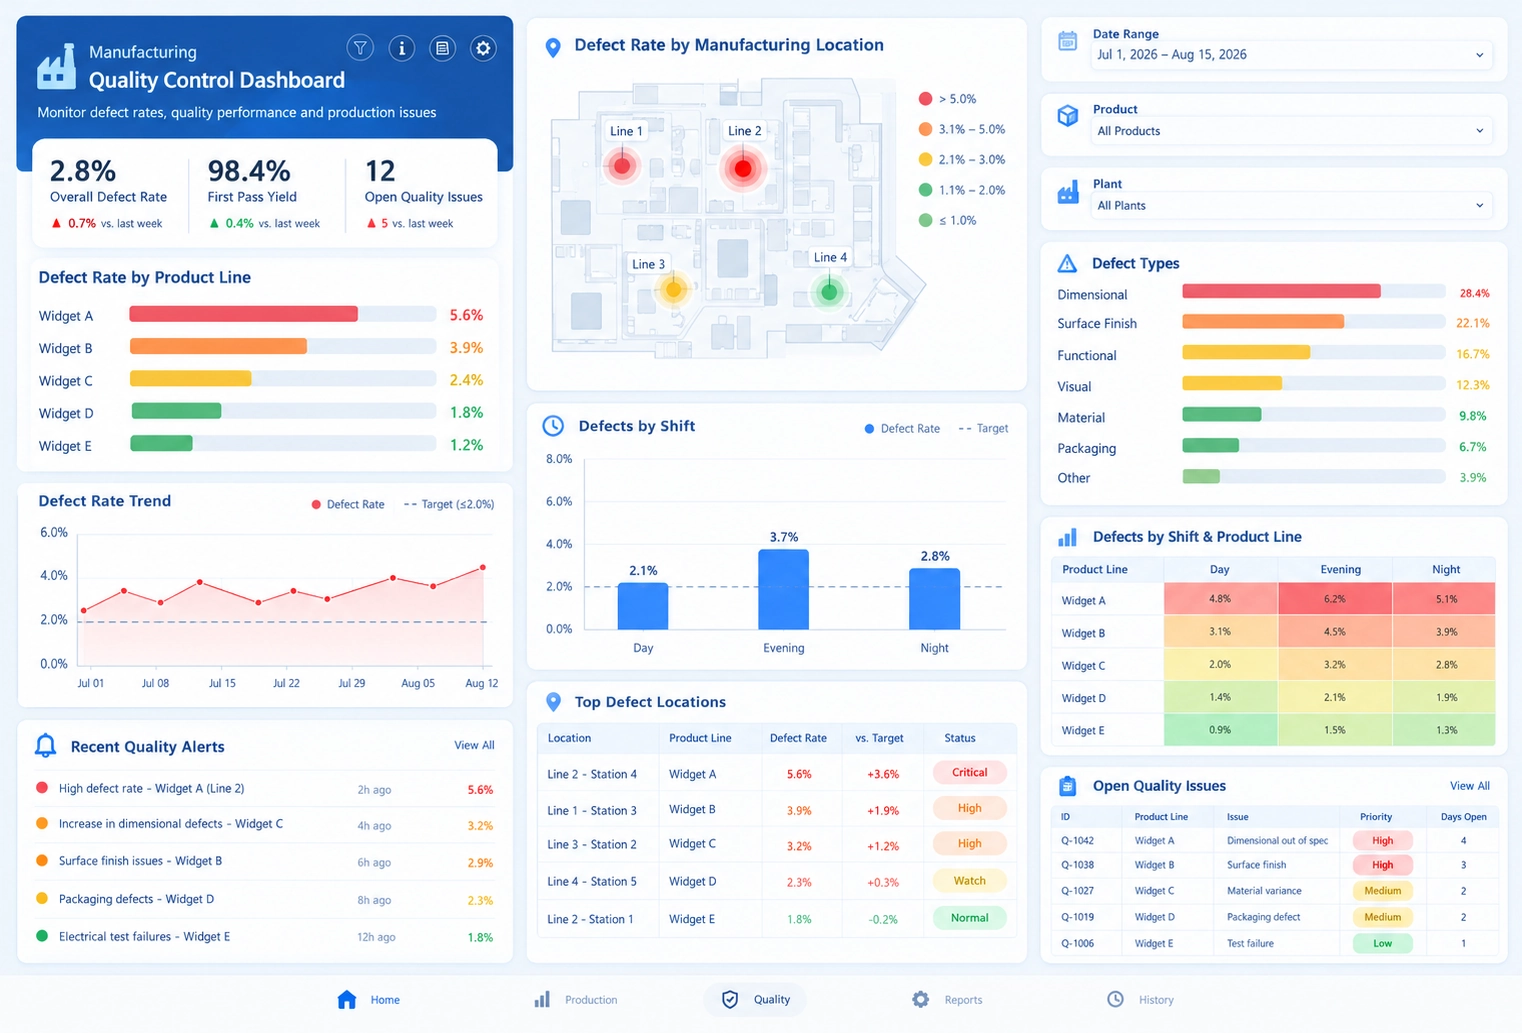
Benefits of an Operational Early Warning Dashboard
- Identifies issues before they become critical.
- Reduces operational disruptions.
- Improves response times.
- Supports proactive decision-making.
- Increases operational efficiency.
- Improves customer satisfaction.
- Reduces financial risk.
- Enhances organizational visibility.
- Supports continuous improvement initiatives.
Common Operational Early Warning Dashboard Use Cases
Manufacturing Operations
Manufacturers monitor equipment utilization, downtime rates, production output, quality defects, maintenance events, and production bottlenecks to prevent costly interruptions.
Supply Chain Management
Supply chain teams track supplier performance, inventory levels, shipping delays, order cycle times, and fulfillment risks that could impact service levels.
Customer Service Management
Service organizations monitor response times, unresolved tickets, customer satisfaction, agent workloads, and service-level compliance metrics.
Healthcare Operations
Healthcare providers use operational warning dashboards to track patient flow, staffing levels, wait times, equipment availability, and compliance metrics.
Information Technology Operations
IT teams monitor infrastructure utilization, system performance, cybersecurity events, application availability, and service interruptions.
Real-World Example
A distribution company operates multiple fulfillment centers across the country. An operational early warning dashboard monitors order volume, staffing levels, inventory availability, and shipping performance.
The dashboard detects a steady increase in order processing times at one warehouse. Although customer deliveries remain on schedule, trend analysis reveals a growing backlog that will soon affect service levels.
Management reallocates personnel and inventory to the affected location before missed deliveries occur. As a result, operations return to normal without customer impact.
Without the early warning dashboard, the issue may not have been detected until customers began experiencing shipment delays.
Best Practices for Designing an Early Warning Dashboard
- Focus on leading indicators rather than lagging metrics.
- Define clear alert thresholds.
- Use color-coded exception indicators.
- Prioritize actionable metrics.
- Support root cause investigation.
- Incorporate trend and forecasting analysis.
- Reduce dashboard clutter.
- Enable automated notifications.
- Review and adjust thresholds regularly.
Operational Early Warning Dashboards with InetSoft StyleBI
InetSoft StyleBI enables organizations to develop real-time operational dashboards that combine KPI monitoring, threshold alerts, exception reporting, interactive drill-down analysis, and predictive trend tracking within a single analytics platform.
By consolidating operational data from multiple systems, StyleBI helps managers identify emerging risks early and respond before they affect business performance, customer satisfaction, or operational continuity.
A More Proactive Approach to Managing Business Performance
An Operational Early Warning Dashboard is a proactive business intelligence tool that helps organizations recognize problems before they become significant business challenges. By monitoring leading indicators, identifying exceptions, highlighting trends, and generating alerts, these dashboards enable faster responses, better decisions, and more resilient operations.
Organizations that implement operational early warning dashboards can reduce risk, improve efficiency, strengthen service delivery, and create a more proactive approach to managing business performance.