Why Do Dashboards Show Different Numbers?
Organizations often compare multiple dashboards and discover that the numbers do not match. This can create confusion, reduce trust in analytics, and make decision-making more difficult. Understanding the reasons behind dashboard discrepancies is the first step toward improving reporting accuracy.

Quick Answer
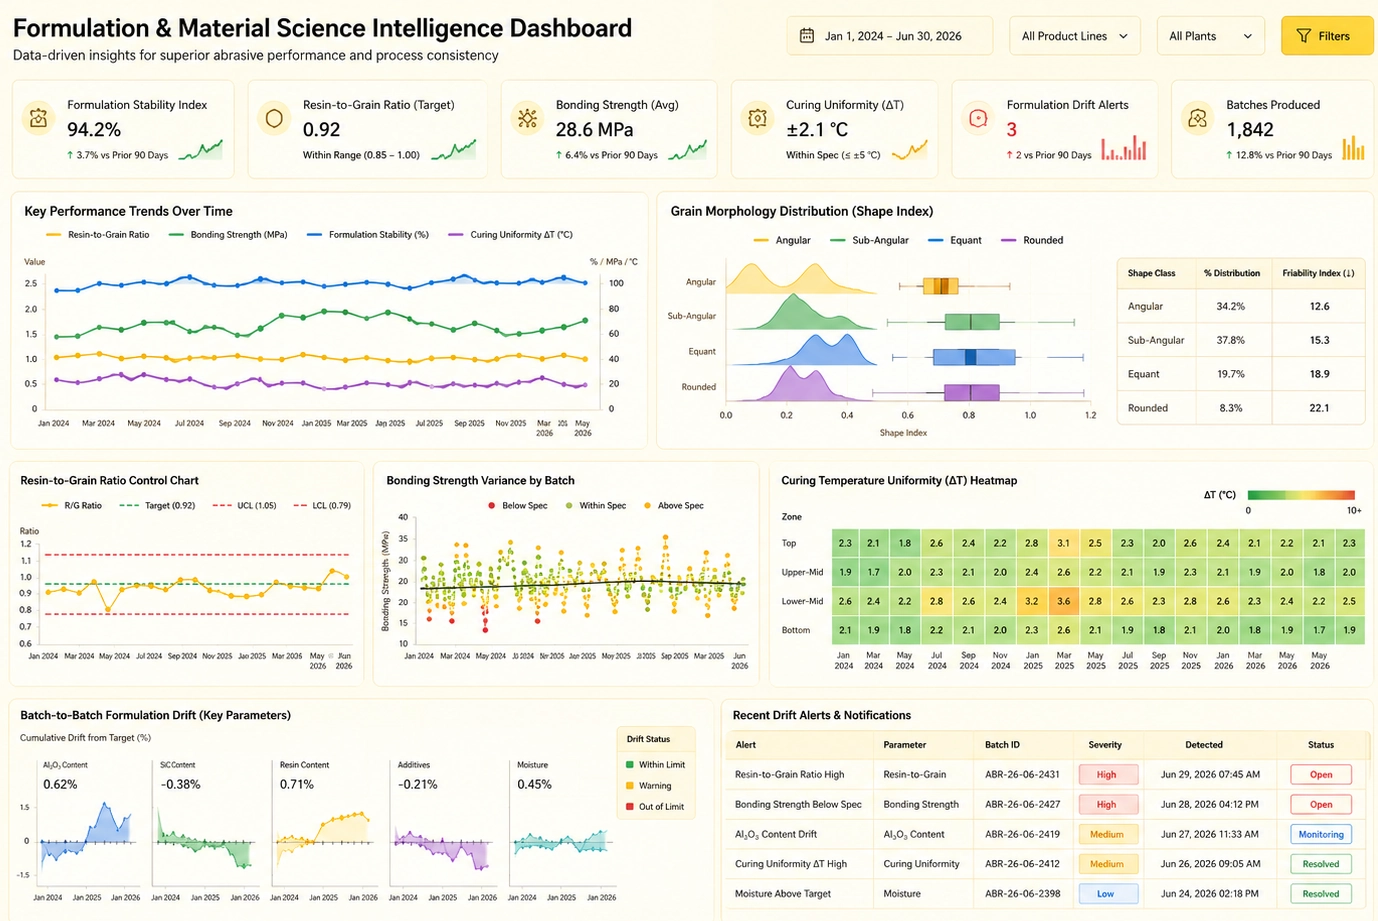
Dashboards show different numbers because they may use different data sources, refresh schedules, filters, calculation methods, business definitions, or security permissions. In many cases, the dashboards are working correctly but were designed for different reporting purposes.
Common Reasons Dashboards Show Different Numbers
Several factors can cause reporting discrepancies across dashboards. Understanding these factors can help business users and analysts reconcile conflicting metrics.
1. Different Data Sources
Two dashboards may pull information from completely different systems. One dashboard might use data from an enterprise data warehouse, while another uses operational databases, spreadsheets, CRM applications, or cloud services.
Even when systems contain similar information, differences in synchronization and data processing can result in different outcomes.
2. Different Refresh Times
A dashboard updated every fifteen minutes may display more recent information than a dashboard refreshed once per day. Comparing reports without checking refresh timestamps can make it appear that numbers are inconsistent.
Refresh schedules are one of the most common causes of dashboard discrepancies.
3. Different Metric Definitions
Organizations often define metrics differently across departments. Sales, finance, operations, and marketing teams may each use unique business rules to calculate the same KPI.
For example, one dashboard may define revenue as booked sales while another reports recognized revenue. Both reports may be accurate according to their intended definitions.
4. Filters and User Selections
Dashboards frequently include filters for dates, products, regions, customer segments, business units, and other dimensions.
A user comparing two dashboards may unknowingly analyze different subsets of data, leading to different results.
5. Calculation Logic Differences
Variations in formulas can significantly impact dashboard values. Calculations involving averages, distinct counts, percentages, forecasts, and custom business rules may produce different results across reports.
Even small differences in calculation logic can create noticeable reporting variations.
6. Data Quality Issues
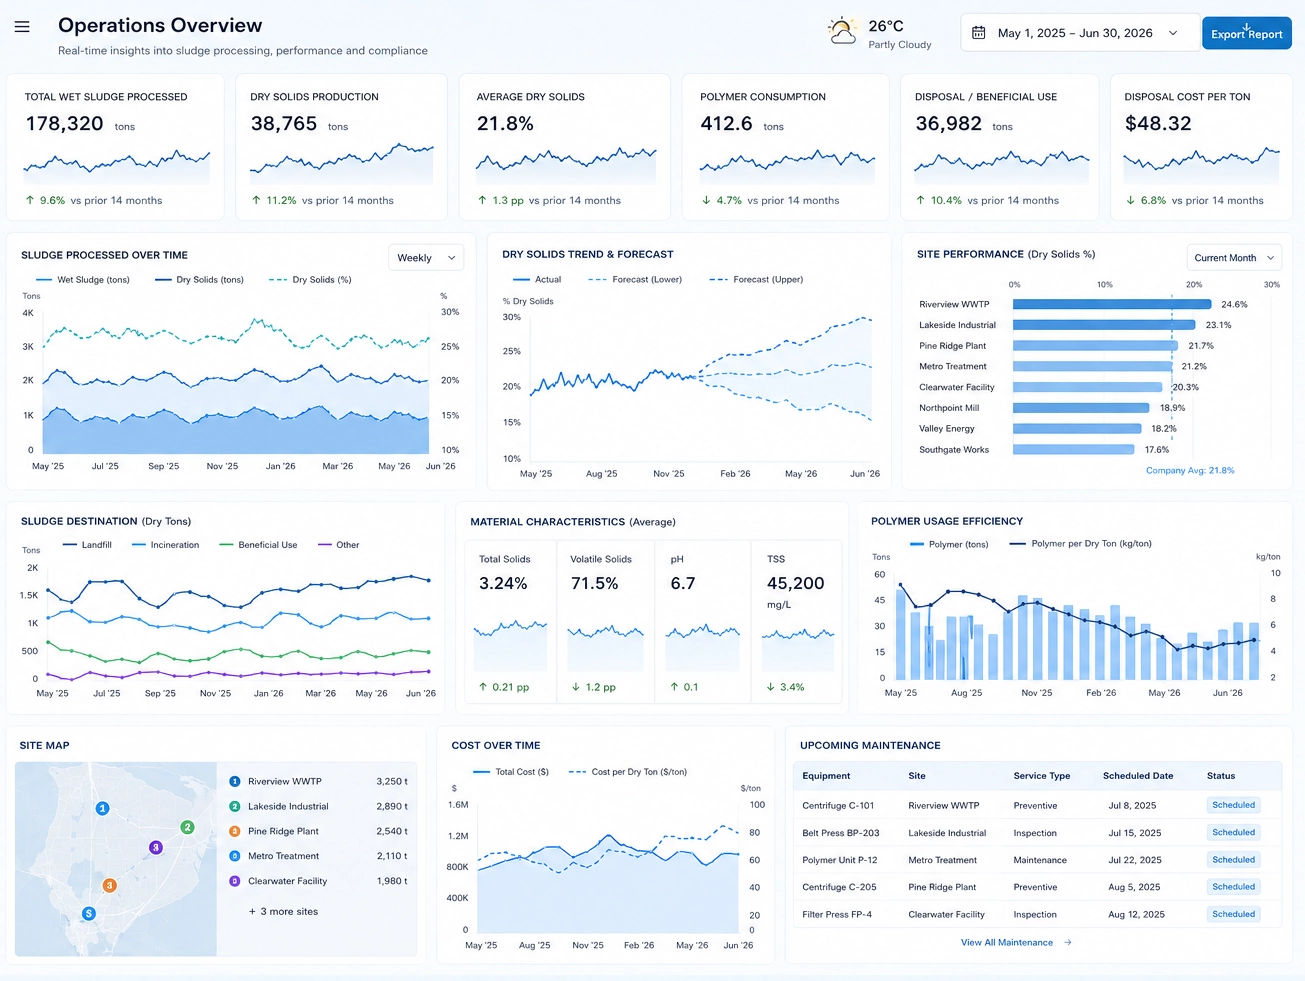
Poor data quality can lead to inconsistent reporting. Missing records, duplicate entries, invalid values, and integration errors often create discrepancies between dashboards.
Organizations that prioritize data quality typically experience fewer reporting conflicts.
7. Security and User Permissions
Many analytics platforms use row-level security and role-based access controls. Different users may only be allowed to view specific records.
As a result, two users viewing the same dashboard may see different numbers based on their permissions.
Example Scenario
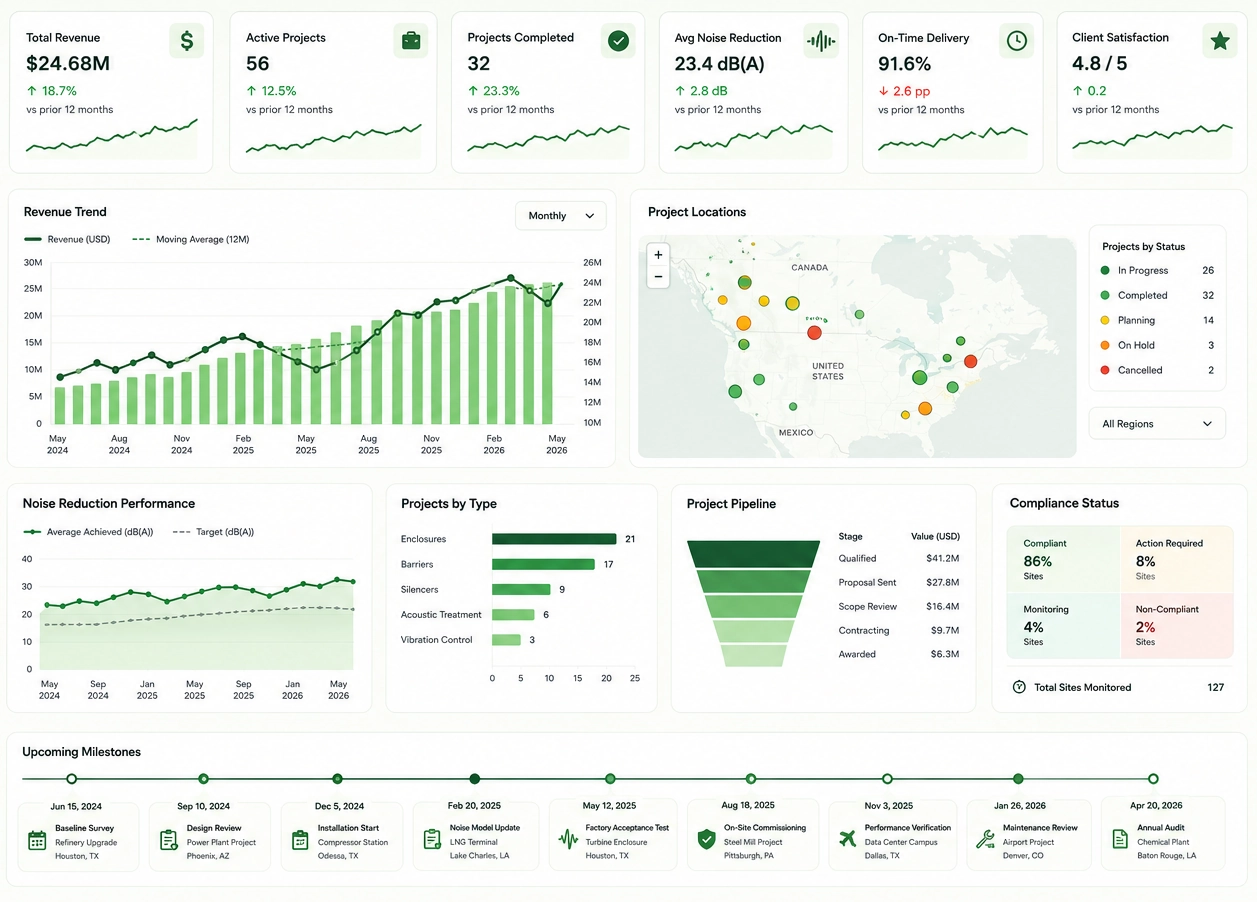
A company compares performance metrics across two sales dashboards:
- Dashboard A reports $2.4 million in monthly sales.
- Dashboard B reports $2.1 million in monthly sales.
After investigation, analysts determine that Dashboard A includes open orders while Dashboard B only includes completed transactions. The discrepancy is caused by different business definitions rather than a reporting error.
How to Investigate Dashboard Discrepancies
- Verify the data source used by each dashboard.
- Review refresh schedules and timestamps.
- Compare dashboard filters and parameters.
- Validate KPI definitions.
- Analyze calculation formulas.
- Review user access permissions.
- Check source-system data quality.
- Document findings and establish standards.
Best Practices for Consistent Dashboard Reporting
- Standardize KPI definitions.
- Create a centralized business glossary.
- Establish a governed semantic layer.
- Maintain a single source of truth.
- Document reporting calculations.
- Monitor data quality processes.
- Display data refresh timestamps.
- Implement dashboard governance policies.
These practices help improve trust in analytics and reduce confusion caused by conflicting reports.
Answer Summary
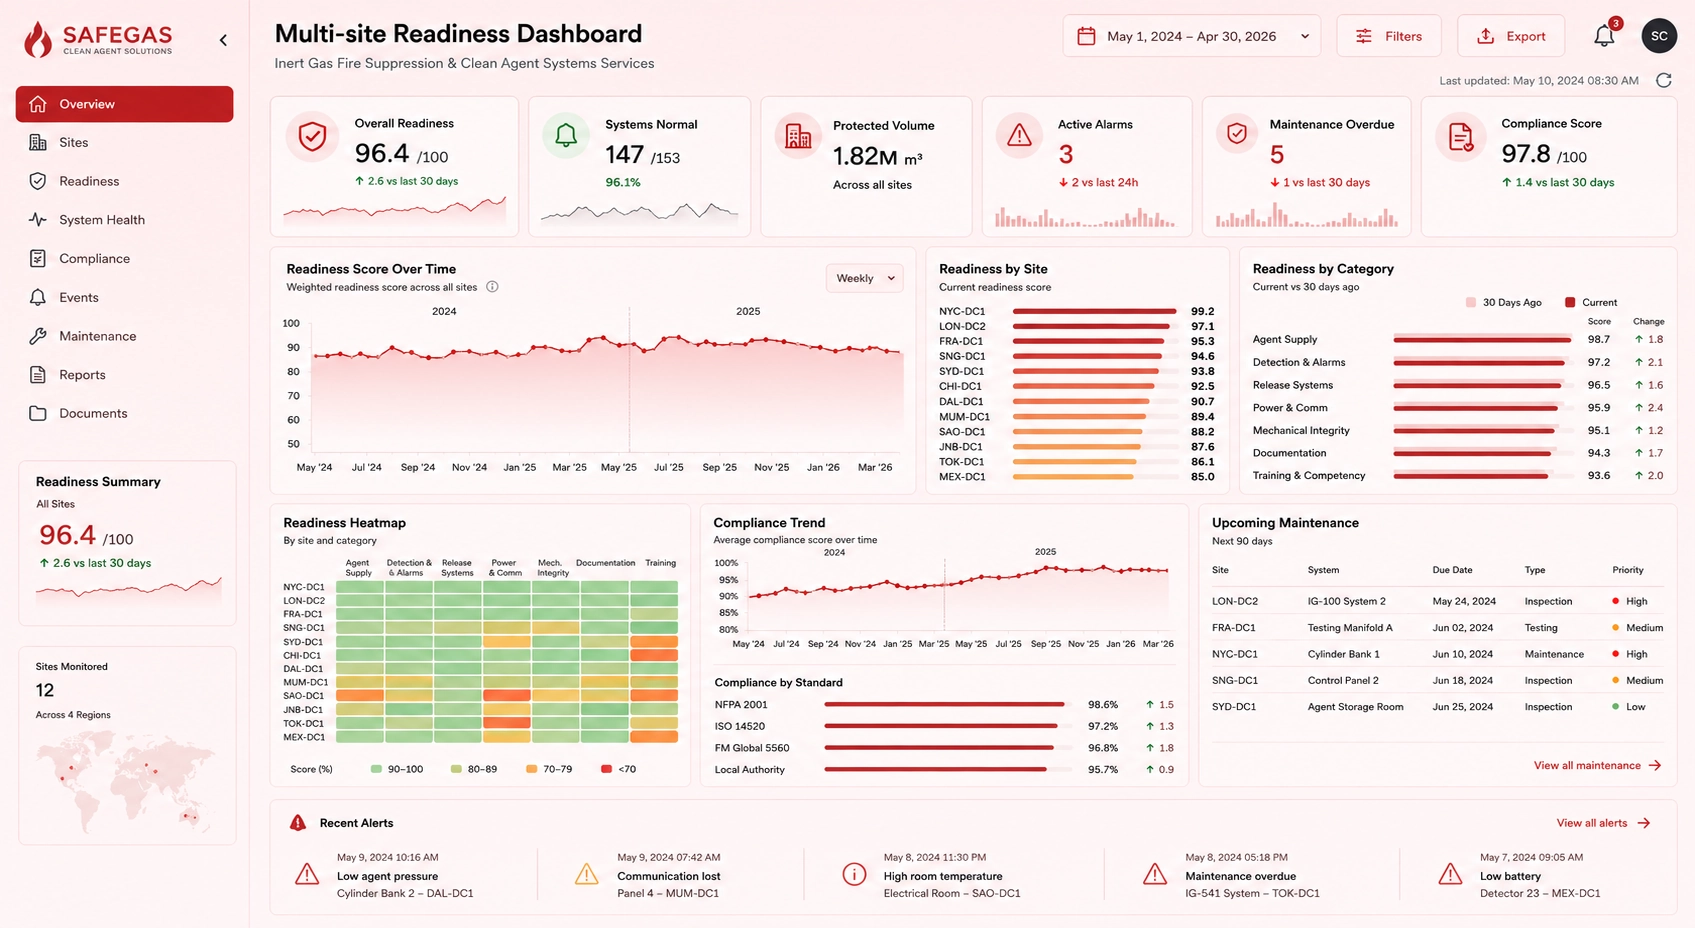
Dashboards show different numbers because they often rely on different data sources, refresh schedules, filters, calculation methods, business definitions, or security rules. The discrepancy does not necessarily indicate an error. In many cases, each dashboard is designed for a specific purpose and follows its own reporting logic. Organizations can reduce dashboard inconsistencies by standardizing KPI definitions and maintaining a single source of truth.
Frequently Asked Questions
Why do two dashboards show different numbers for the same metric?
Different dashboards may use different data sources, calculation methods, business definitions, or filtering criteria.
Is it normal for dashboards to display different values?
Yes. Different values are common when dashboards serve different business functions or operate on different refresh schedules.
Do dashboard discrepancies always mean there is a problem?
No. Many discrepancies occur because reports were designed with different business rules and objectives.
What is the most common reason dashboards do not match?
Differences in filters, date ranges, refresh timing, and KPI definitions are among the most frequent causes.
How can organizations improve consistency across dashboards?
Organizations should establish governance standards, document metric definitions, and maintain a centralized source of trusted business data.
Standardizing Reporting Logic
Understanding why dashboards show different numbers is essential for effective business intelligence. Most discrepancies can be explained by differences in data sources, refresh schedules, filters, calculations, metric definitions, or security settings. By implementing governance practices and standardizing reporting logic, organizations can improve dashboard consistency and increase confidence in their analytics.