What Are Reporting Elements?
Reporting elements are the individual building blocks that make up a report or dashboard in business intelligence and analytics tools. They are the visual and structural components you place on a page to present data, context, and interaction to the user. By combining different reporting elements, you turn raw data into a readable, actionable story.

Core Data Display Elements
These elements are responsible for actually showing the data:
- Tables and Grids: Row‑and‑column layouts that present detailed records, summaries, or cross‑tabulations. They are ideal for precise, line‑item information such as transactions, invoices, or logs.
- Charts and Graphs: Visual representations of data, including bar charts, line charts, pie charts, area charts, scatter plots, and more. Charts help reveal trends, comparisons, and distributions at a glance.
- KPI Tiles and Scorecards: Compact elements that highlight key metrics such as revenue, conversion rate, or uptime. They often include color indicators (red/green), arrows, or icons to show performance vs. target.
- Pivot Tables and Crosstabs: Summarized views that allow users to slice and dice data by multiple dimensions (e.g., region by product by month).
Context and Layout Elements
These elements provide structure, labels, and narrative around the data:
- Titles and Subtitles: Describe what the report or section is about, giving users immediate context.
- Headings and Section Breaks: Organize content into logical groups (e.g., “Sales Overview,” “Customer Detail,” “Operational Metrics”).
- Text Blocks and Annotations: Explanatory text, commentary, or instructions that help users interpret the visuals and understand key takeaways.
- Headers and Footers: Repeated elements that can include report name, date, page numbers, logos, or disclaimers.
- Images and Icons: Logos, product images, or icons that support branding and visual clarity.
Interactive Elements
Interactive reporting elements let users explore and personalize the view:
- Filters and Slicers: Controls (dropdowns, checkboxes, sliders) that allow users to limit the data shown by date, region, product, or other dimensions.
- Parameters: Inputs that drive calculations or queries (e.g., “Select Year,” “Enter Threshold”), often used in pixel‑perfect reports.
- Drill‑Down and Drill‑Through Links: Clickable elements that take users from a summary view to more detailed reports or related dashboards.
- Sorting and Grouping Controls: Options that let users reorder or regroup data directly in the report.
- Tooltips and Hover Details: Additional information that appears when users hover over a data point, providing context without cluttering the main view.
Formatting and Styling Elements
These elements influence how information is perceived and prioritized:
- Conditional Formatting: Rules that change colors, fonts, or icons based on values (e.g., highlight negative margins in red).
- Borders, Shading, and Spacing: Visual separators that make complex reports easier to scan and read.
- Number and Date Formats: Formatting for currencies, percentages, dates, and times to ensure clarity and consistency.
Why Reporting Elements Matter
Reporting elements are not just cosmetic; they determine how quickly and accurately users can understand data. Well‑chosen elements:
- Improve readability by structuring information logically.
- Highlight what matters through KPIs, color, and layout.
- Enable exploration via filters, drill‑downs, and interactive charts.
- Support governance by standardizing how metrics and dimensions are presented across reports.
In short, reporting elements are the vocabulary of reporting and dashboards. Mastering them lets you turn raw data into clear, compelling stories that different audiences—executives, analysts, and frontline staff—can act on with confidence.
Managing Report Elements - InetSoft's reporting software allows users to manage report elements to create stunning visual representations of complex data. A report is made up of multiple elements. Examples of report elements are Text, Table, Chart, etc. You can manipulate the properties of each element independent of the others in that report. This section reviews the properties of each element using the 'Ad Hoc' report in the ‘Tutorial’ folder, but you can follow along with any report. Menu items that are common to all elements (e.g., ‘Data Query’) are discussed later. You can change any element’s position or add additional elements using ‘Move’, ‘Insert’, and ‘Append’. Make sure you are in Ad Hoc mode. Right-click on any element and you will see a menu like those below. (The ‘Append’ menu is identical to the ‘Insert’ menu). Additional options might be available depending on the element. You can use ‘Move’ to move an element up or down. ‘Insert’ allows you to insert an element in the report. ‘Append’ allows you to add an element after the current one. Following are the elements that can be inserted/appended using the above feature...
Managing Report Server Clusters - The enterprise manager in InetSoft's reporting software is an intuitive interface that allows for superior management of report server clusters in order to optimize the speed and performance of the application. Once the previous operations are completed, each cluster Node must be defined inthe 'Clustering' page of the Enterprise Manager by clicking on the 'Add' button. The 'Clustering' page is only visible if the selected server type supports clustering. Each cluster node must have an unique license key. For InetSoft products prior to v9.0, each cluster node should also have a corresponding license file, the first key corresponding to the first license file, and so on. All the license files may exist in a shared registry directory. If license files are to be manually set up, then edit the sree.properties file in the shared registry directory and add the following lines...

Managing the Report Repository - Users of InetSoft's reporting software are able to manage the report repository in order to improve performance and make necessary ad hoc adjustments for ease of use. The report repository is the collection of deployed reports (replets) and Viewsheets. You can manage the repository through the Report tab in the Enterprise Manager. Reports and Viewsheets can be grouped into folders for organization, and folders can be hierarchically nested. When a folder is deleted, all of the subfolders and related reports will be deleted as well. If a security provider is selected, users (and roles) can be given read and write permission for either folders or individual reports and Viewsheets. Both replet classes and report templates can be registered as replets. The repository can be viewed by users through the Report Portal or alternative viewer. From the 'Repository' node, under the Report tab, you can do the following tasks...
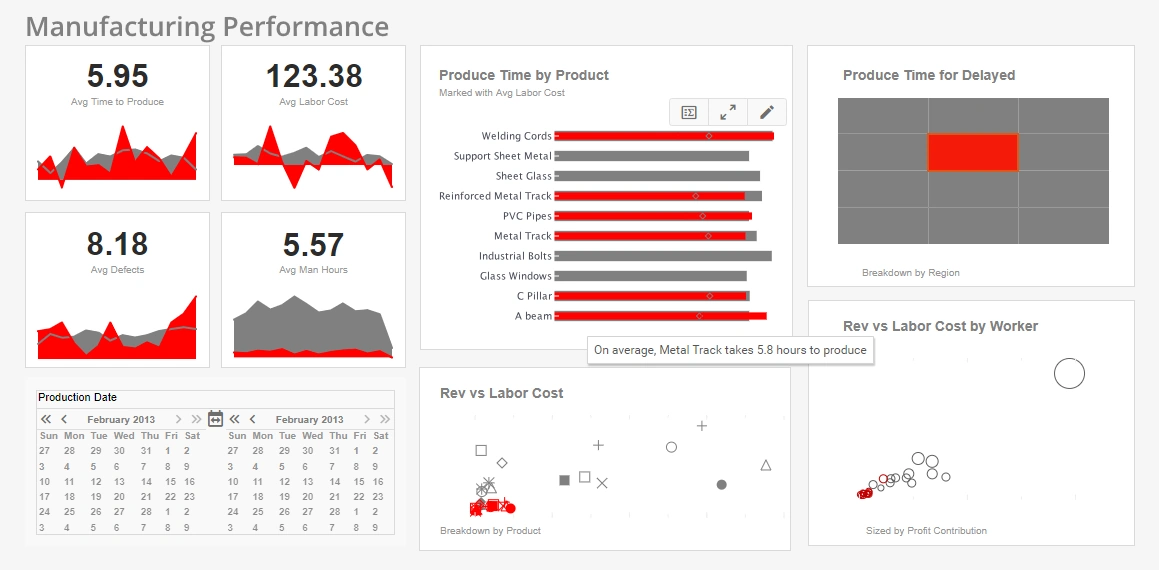
Manufacturing Reporting for Quality Control - This Manufacturing Quality Control Dashboard enables quality control managers to monitor and analyze everything, from defects rate and pipeline duration to shift performance and technician performance, all in one dynamic view. With built-in filtering components, manufacturing professionals can easily slice and dice data with simple point-and-click methods to get various insights...
MariaDB Reporting Tool - Looking for a good reporting tool to use with MariaDB? InetSoft's pioneering reporting application creates great dashboards and reports for MariaDB users with an easy-to-use drag-and-drop designer. View a demo and try interactive examples...
Marketing Report Software - Marketing reporting software is crucial for analyzing a marketing department's leads, progress, and traffic. Software is particularly useful to marketing professionals when it comes to measuring the effectiveness of digital marketing campaigns, tracking the performance of blog posts, external website links, and search engine rankings...
Marketing Reports to Build First - In the world of marketing, having a clear roadmap matters. This is where marketing reports come into play. They don't just show us our past moves, they help us shape our next steps. With 63% of businesses increasing their digital marketing budgets in past years, it's evident that the role of marketing reports has never been more crucial. Without these 7 fundamental reports, it's easy for even the best marketing strategies to drift off course. This article will explain the top marketing reports, highlighting their crucial role in guiding successful campaigns. A marketing report is a structured document that presents the performance and outcomes of marketing strategies and campaigns. It translates raw data into actionable insights, highlighting successes, areas for improvement, and trends. These reports help businesses to make informed decisions and refine their marketing approaches. The frequency of creating a marketing report largely depends on the business's objectives and the nature of its campaigns: Daily, weekly : best for fast-paced campaigns, allowing for real-time monitoring and swift strategy adjustments. For more extended campaigns, a weekly marketing report can help assess if everything is progressing as intended, allowing teams to spot potential issues and refine the strategy if needed...

Marketing Reporting - A case study of a marketing reporting solution built with InetSoft's dashboard and reporting software - which can be used to access and report on any type of data, including marketing data. This InetSoft client requested to remain confidential. They are a provider of comprehensive, integrated, unique, and highly cost-effective marketing services at every level of healthcare marketing. Through a combined assembly of “best in class” business disciplines, the company provides an effective, forward-thinking, and proven range of services that include Marketing Insights, Clinical Marketing, Field Level Marketing, Advertising, and Promotion. Information delivery to clients is a central capability in all of the company’s marketing services. The company has built a Web-based portal application for information access and sharing between its staff and clients. It came time to enhance and upgrade an existing reporting and dashboard solution licensed from another vendor, and the company chose InetSoft for its high degree of integration-readiness and for its flexibility in technology licensing options...
Marketing Reporting Tools - InetSoft's reporting tools allows marketers to create web-based interactive reports that can take the viewer from a high-level view of marketing performance down into the details for further investigation. Advanced visualization allows for a further analysis and multidimensional exploration of data.
Medical Dashboard Examples - Are you looking to build medical dashboard examples? Try out this interactive Mortality Analysis dashboard from the InetSoft live dashboard gallery. This dashboard was made with InetSoft's commercial dashboard builder StyleBI™. The ease of use and high level of interactivity in this example are proof of InetSoft’s core concept of deploying advanced visualization without sacrificing computing power. In this medical report example you can easily wring a huge variety of statistics surrounding national mortality. The visuals can be displayed by age, race, gender or cause. You can filter out specific diseases with each Cause or zoom in for an intimate analysis within certain communities. Easily spot the major causes or drill down to find the way certain causes affect demographics differently. In this sales dashboard example you can see StyleBI balance...
Metric Reporting Software - Looking for good metric reporting software? InetSoft's pioneering BI application produces great-looking cloud-based dashboards with an easy-to-use drag-and-drop designer. Maximize self-service for business users and developers. View a demo and try interactive examples...

Microsoft Access Report Builder Tool - Looking for good report builder software for MS access. InetSoft's pioneering dashboard reporting application produces great-looking web-based reports that can be presented anywhere. View a demo and try interactive examples...
Miscellaneous Report Properties - Find information about miscellaneous report properties in InetSoft's reporting software - a leading provider of business analytics since 1996. The following table lists a variety of miscellaneous properties. If a number format is not specified in the designer, this property value controls the rounding of the numbers. The property values are the same as the valid arguments for the 'formatNumber()' method. Default grouping and ordering is now case-insensitive, which is consistent with most databases. Set this property to true to revert to pre-9.1 behavior. If “true,” top and bottom margins, and headers and footers will be set in Excel's “Page Setup”. For Excel export, a factor determining whether nearby report elements are placed in adjacent cells or spaced apart. A smaller factor creates more space between elements in the exported spreadsheet. If query variables are declared as unique, variables with the same name across different queries are treated as one variable. Otherwise, each query contains its own set of variables. The output resolution of the barcode when either the barcode is being outputted to a device other than the screen, or the barcode is being generated on a headless machine and the screen resolution could not be determined. The default resolution is 72 dpi...
Mobile BI Software - The latest version of InetSoft's award-winning software provides deepened support for mobile BI on Apple' iOS devices such as the iPhone' and iPad'. MBI puts Key Performance Indicators (KPI) right at your fingertips, delivers real-time data mashup, interactive dashboards, customizable visualizations, and...
Mobile BI Solutions - Have you ever found yourself or a colleague unable to make a critical meeting? Is it often difficult to get remote personnel the most recent data? Studies suggest that organizations who give more people access to BI are more effective at reaching corporate goals. And what the industry is seeing now...
Mobile Reporting - Looking for a BI solution that offers effective mobile reporting? Leaving the office doesn't have to mean leaving behind valuable, up-do-date information. InetSoft's StyleBI offers access to corporate information via a broad array of mobile devices. Executives can easily track KPI's regardless of where they are. Having BI accessible via mobile is essential if you have executives who travel or employees who work out in the field. InetSoft's BI platform allows you to perform the same data explorations and stunning visualizations that can be done on a desktop computer. Flexible mobile reporting allows for more than just alerts sent to your phone; real time reporting tools let you interact with your data.When you have the power to not only access results, but to also leverage and explore data relationships on the go, you will maximize your performance...
Mobile App Reporting Tool for Appfigures - Looking for a good solution for Appfigures dashboard reporting? Mashup your mobile app data with other enterprise data for a wider view of performance. InetSoft's pioneering BI application produces great-looking cloud-based dashboards with an easy-to-use drag-and-drop designer. View a demo and try interactive examples...
Mobile Reporting Tools - There's no question that the evolution of mobile technology in recent years has been a major game-changer in both our private and professional lives. Nowadays, it seems like everyone has their own smartphone or tablet, so a reporting solution that is compatible with these devices is a natural fit. Such a solution can empower your employees and accelerate the growth of your business. StyleBI, by InetSoft, is that solution...
Modifying Report Data Source - Modifying the report data source allows users of InetSoft's reporting software to make ad hoc changes to reports that are difficult to accomplish via traditional data warehousing techniques. This section explains how to use the built-in Ant task to automatically change the data source definition. To use the built-in Ant task to automatically change the data source definition, follow the steps below: 1. Make sure Ant-related jar files and sree_pro.jar (or alternates visual_pro.jar, bisuite_pro.jar) are included on the classpath. 2. Create an Ant task definition in build.xml as follows Thus, use the dss task to modify the datasource.xml and use the war or jar task to create a webapp. If restore=true, the datasource.xml file will be restored back to its original state after the build is finished. 4. Depending on the type of database, within the <dsm> tag, define one of the attributes listed under available DSM tags. 5. Run the Ant task. This section lists the available attributes for the <dsm> tag. You do not need to specify all the attributes listed here, only the ones that you wish to modify...
MongoDB Reporting Tool - Looking for a good MongoDB reporting tool? InetSoft's pioneering dashboard reporting application produces great-looking web-based reports and dashboards with an easy-to-use drag-and-drop designer. View a demo and try interactive examples...
Monitoring Report Scheduler Tasks - Monitoring report scheduler tasks can be done with ease with InetSoft's powerful reporting software, a multi-award winning java-based business intelligence solution. All scheduler tasks (belonging to admin and all other users) and their status' can be viewed and monitored from the Enterprise Manager: • Select the Schedule tab and select the 'Scheduled Task' node from the tree. A list of all of the scheduler tasks is displayed. You can view the start time, the end time, the status of the last run, and also the start time for the next scheduled run. • Temporarily disable or enable a task by using the checkbox under the 'Enabled' column. • Click on a task name to select it. Click the 'Run Now' button to execute the task immediately. • Click the 'Stop Now' button to halt a task in progress. A scheduler cycle is a single time condition. Scheduler (data) cycles are used to specify generation times to refresh pregenerated reports, e.g., a report executes every day at 7.00 am...Monitoring Report Server Activity - InetSoft's StyleBI makes monitoring report server activity simple by providing the tools for self monitoring. The 'Monitoring' node under the Server tab also allows you to monitor and manage a variety of aspects of server activity. On these pages, you can view reports, Viewsheets, and queries that are currently executing on the server, and can terminate undesired activity. You can also view the current users logged in, and terminate any undesired sessions. The 'Help Configuration' page under the 'Configuration' node allows you to specify the location of the HTML documentation files. Enter an absolute path or relative path (relative to server root) to the parent directory of the “_HTMLDoc.htm” help file. Users can view end-user documentation by clicking the 'Help' link in the User Portal, or by clicking a 'Help' button in Visual Composer. Administrators can view the developer documentation by clicking the 'Help' link in Enterprise Manager...
Monitoring User Reports - InetSoft's StyleBI enables administrators to monitor user reports with a robust set of tools that allow for quick modifications and extensive performance options. The 'Users' page under the 'Monitoring' node provides key information about user logins, and allows you to terminate a given user session. In a clustered environment, select a machine from 'Cluster Node' menu to view the monitoring statistics for that machine. The page provides the following information. To terminate a user session, click the 'Select' box next to the desired user, and then click the 'Logout' button. The 'Exceptions' page under the 'Monitoring' node provides key information about asset exceptions and system exceptions. An asset exception is one that causes a report or Viewsheet to fail. A system exception is one that causes a critical system failure, such as out-of-memory. In a clustered environment, select a machine from 'Cluster Node' menu to view the monitoring statistics for that machine...
Monthly Report Consolidation Tools - Are you looking for a good monthly report consolidation tool? InetSoft's pioneering reporting application mashes up financial data from multiple sources to produce pixel-perfect consolidation report pdfs with an easy-to-use drag-and-drop designer. Get cloud-flexibility for your deployment. Minimize costs with a small-footprint solution. Maximize self-service for all types of users. No dedicated BI developer required. View a demo and try interactive examples...
Monthly Report Tool - Looking for the best monthly report tools? InetSoft's pioneering dashboard reporting application produces great-looking web-based or paginated reports. The software has been op rated by customers for personalized support on G2. View a demo and try interactive examples...

More Effective Salesforce Reports Solution - Looking for a better solution than Salesforce Reports? InetSoft's pioneering BI application produces great-looking reports that give you more formatting control. And InetSoft's data mashup tool allows the combination of data from other enterprises sources to your sales reports. View a demo and try interactive examples...
More Reporting Classes - A report bean is a reusable report component that is stored in a bean library archive file (*.srl). The inetsoft.report.BeanSheet class extends the StyleSheet Class. The properties of elements that are laid out on a BeanSheet can be selectively exposed so that they can be manipulated by the report that uses the Bean. The inetsoft.report.Previewer provides a way to preview the report before printing. It is a standalone window and can be opened by the main application. Another class, inetsoft.report.PreviewPane, can be used to create a panel that can be dropped into a user-defined container. JPreviewer is a Swing based previewer. It implements the PreviewView interface and can be used in the same way as the Previewer. The inetsoft.report.TableLens interface defines the API for InetSoft table models. The ReportSheet accepts TableLens objects as tables. There are several ways to get a TableLens object, which will be covered later in this document. The inetsoft.report.lens.swing and inetsoft.report.lens.teaset2 contain table adapter classes to create a TableLens object from a Swing JTable or a Tea Set grid...
MySQL's Advantages and Disadvantages for Analytical Reporting - Can MySQL be used for data analytics and reporting? Thousands of installations, configuration, and optimization manuals and courses for MySQL are available online. None of these articles, however, ever pause to consider if MySQL is the best option for business intelligence. The apparent qualification being that the scope, schedule, and budget of each project vary. By listing some of its features, this article will try to address the topic of how Oracle's MySQL fits into the world of analytics. This essay will not tell you if MySQL is excellent or bad, but rather whether it could be a suitable choice for a BI project. What kind of data are you looking at? In order to handle relational data, MySQL was created. Don't even think about using MySQL if you have a lot of qualitative data, such as social media postings, photos, or text. There are NoSQL systems, such as MongoDB, that are far more suited for this role, despite the fact that MySQL has made efforts to better manage these sorts of data. This is particularly true if you want to use the data to conduct analytical queries...
MySQL Reporting Tool with Drilldown - Looking for a good MySQL reporting tool with drilldown capabilities? InetSoft's pioneering dashboard reporting application produces great-looking web-based reports and dashboards with an easy-to-use drag-and-drop designer. View a demo and try interactive examples...
Net Promoter Score Reporting Tool - Looking for a good solution for AskNicely reporting? InetSoft's pioneering BI application produces great-looking dashboards that mashup net promoter score data with other data sources in your organization. View a demo and try interactive examples...
.NET Reporting Solution - Are you looking for a .net reporting solution? Since 1996 InetSoft has been making BI software that is easy to deploy and easy to use. As a web-based application, InetSoft makes a good option for delivering self-service oriented reporting dashboards. View a 3-minute demo and download a free version...

New Financial Reporting Toolset - We have the next 45 minutes set aside to focus on a new financial reporting toolset that will give you access to your financial system data, so you can write reports in minutes. It’s our pleasure to share with you a proven reporting solution. Based on the registration details, some of you have heard about the solution from your peers. We thank them for spreading the good news. So how can you create your financial reports within minutes? Really, we have been asked a lot, is it that easy? The answer is yes. First, we will walk through the reporting solution, and answer some of the questions that you have. Next, we will create a report in minutes. We will walk through some financial reporting exercises. Then we will walk through human capital management exercises. You will have a view of the standard reports. Then we will look at how you can schedule these reports. Then we will show you how you can use query and analysis tools to write some analyses and reports. So what is query and analysis? It’s a reporting tool and an analysis toolset that is proven. I mentioned that earlier, it’s used by over 3,000 InetSoft customers globally every day. It gives you real-time access to your financial data...
New Relic Reporting Tool - Looking for a good solution for New Relic dashboard reporting? Mashup your mobile app data with other enterprise data for a wider view of performance. InetSoft's pioneering BI application produces great-looking cloud-based dashboards with an easy-to-use drag-and-drop designer. View a demo and try interactive examples...
New Reporting Software - Are you looking for new reporting software for you business? StyleBI by InetSoft is just the thing your business needs to get those reports out the door. StyleBI allows you to present information to your clients and coworkers through reports and dashboards. These tools are flexible and offer creation tools suitable for all levels of your business. Behind both the reporting and dashboarding interface is a powerful scripting and engine that empowers your IT department to customize the program to you exact specifications. For the more layman business users, StyleBI offers a drag-and-drop interface combined with wizard-guided creation tools. Making a report or dashboard to share with others has never been easier. StyleBI is a zero client Web-based tool. As such, it is capable of running on any device with a Web browser, be it a desktop or a mobile phone. At InetSoft, we feel that flexibility and convenience are some of the most important aspects of a commercial business tool...
OLAP Reporting - Information for those looking for OLAP reporting. InetSoft provides dashboards, reporting & visual analysis software that can access OLAP data sources and cubes. Created for professional report designers with advanced features, the Report Designer is a powerful desktop application that is used to produce both simple and highly complex pixel-perfect paginated reports for online viewing or scheduled automated distribution. Embedded logic and flexible layout are a few example features of advanced report design. Created for professional report designers with advanced features, the Report Designer is a powerful desktop application that is used to produce both simple and highly complex pixel-perfect paginated reports for online viewing or scheduled automated distribution. Embedded logic and flexible layout are a few example features of advanced report design. End users can define alerts and notifications based on individual reports. Trends, thresholds, and time conditions can also be combined to define an alert condition. Distribution lists can be created and maintained...
OLAP Cube Reporting - OLAP cubes are a confusing subject, to say the least, and while your IT department may be familiar with the concept, most of your other employees probably aren't. So then why deal with them if you don't have to? OLAP is an acronym for online analytical reporting. OLAP cubes are an older data warehousing technology for databases. They are optimized for summarizing and aggregating information...
On-demand Ad Hoc Reporting - Information about InetSoft's award-winning reporting software designed for easy, intuitive on-demand ad hoc reporting. Highlights include: naturally cross platform as a Java-based application, drop-in deployment into any J2EE platform, supports both transactional databases, data warehouse, and OLAP cubes...
Online Client Reporting Tools -Effective online client reporting is essential for an organization's progress and should be implemented at all levels ranging from employees to owners and executives. The right online client reporting software will make it easy to keep all of an organization's activities in check...
Online Dashboards and Reporting Software - Looking for good online dashboards and reporting software? InetSoft is a pioneer in self-service dashboards and production reporting. View a demo and try interactive examples...
Online Presentation and Reporting Software - Looking for good presentation and reporting software. InetSoft's pioneering dashboard reporting application produces great-looking web-based reports that can be presented anywhere. View a demo and try interactive examples...
Online Report Creation Tool - Looking for good report creation tools? InetSoft's pioneering reporting application is easy to use and powerful enough for production reporting. View a demo and try interactive examples...
Online Reporting Service - Are you looking for a way to create reports and track business performance? InetSoft's online reporting service is the ideal tool for users wanting to track their KPI's remotely without having to rely on specialized IT professionals and endless hours of setup. Whether it's installed on your local desktop, in the cloud, or at a server at your company's local intranet, this online reporting service allows users to access their reports through a web browser...
Online Report Writer - Evaluate InetSoft's Web-based, Java-based online report writer for rapid production and ad hoc reporting needs...
Online Reporting Software - InetSoft's StyleBI software allows users to create professional reports and dashboards using a simple point-and-click interface. StyleBI is a complete business intelligence platform thanks to its interactive interface that functions in both Flash and non-Flash enabled browsers. Its unique real-time data mashup Data Block™ architecture allows for drag-and-drop combining of data, presentation or functionality from multiple sources...
Online Reporting System - Are you looking for a way to create reports and track business performance? InetSoft's online reporting system is the ideal tool for users wanting to track their KPI's remotely without having to rely on specialized IT professionals and endless hours of setup. Whether it's installed on your local desktop, in the cloud, or at a server...
Online Visual Report Creation - Looking for software to create nice online visual reports? InetSoft's pioneering dashboard reporting application produces great-looking web-based dashboards with an easy-to-use drag-and-drop designer. View a demo and try interactive examples...
Open Source Reporting Tools: A Practical Guide - Open source reporting tools have become a serious alternative to proprietary business intelligence platforms. What started as developer-focused utilities for basic charts and tables has evolved into full-featured reporting environments capable of handling complex data models, multi-source analytics, and enterprise-scale distribution. For organizations that value flexibility, cost control, and transparency, open source reporting is no longer a compromise but a strategic choice. This article explores what open source reporting tools are, why they matter, how they compare to commercial options, and what features actually separate strong platforms from hobbyist projects. It also covers common use cases, architectural patterns, and evaluation criteria that teams should consider before committing to a reporting stack...
Operational Reporting Tool - Operational business intelligence, also referred to occasionally as real-time business intelligence, is a style of data analysis that facilitates decisions based on the real-time data companies generate on a routine basis. Operational business intelligence data is most useful to front-line workers who require up-to-date information to perform well...
Organization Report Tool - Looking for good organization report tools? InetSoft's pioneering dashboard reporting application produces great-looking web-based and pdf reports with an easy-to-use drag-and-drop designer. Maximize self-service for all types of users. No dedicated BI developer required. View a demo and try interactive examples...

Painter Scaling - Painter size is determined by two factors. If an explicit size is supplied, the painter is always painted in that exact size on the output. If the explicit size is different from the painter's preferred size, how the painter is printed is determined by whether the painter is scalable. If the painter's isScalable() method returns true, the painter is scalable. This means that if the final size of the painter is different from its preferred size, the Painter.paint() method handles the scaling automatically and the painter will behave correctly in the new size. In this case, the size passed into the paint() method of painter is the exact size of the painter on the output media. If the painter's isScalable() is false, the painter is not scalable. This means the Painter.paint() method only paints correctly at its preferred size. If the final size of the painter is different from its preferred size, in order to ensure the painter behaves correctly the ReportSheet creates a buffer of the painter's preferred size. The size passed to the paint() method of the painter is always the preferred size of the painter. The buffer (with painter's preferred size) is later scaled in the output media to the actual size. The Image and Component elements are painted as non-scalable painters. Chart and TextBox elements are scalable painters...
Parameter Reports - InetSoft's features parameter report capabilities that make report development a far more efficient task. The parameterized report features allow you to generate multiple versions of a report from a single template by customizing certain aspects of your report before they are delivered to the appropriate users. Our professional authoring tool combines word-processing grade design with dynamic data manipulation. It enables professionals to develop sophisticated reports by using simple business reporting software – a departure from the traditional requirement of using custom programming. We deliver on-demand reports on the Web. In-report exploration capabilities empower business users with the ability to reshape information in real time. High performance streaming and caching ensure the optimal end user experience. InetSoft's report scheduling, bursting, and archiving capabilities allow for flexible batch report generation. Report bursting separates report pages into security controlled sections. Business users' viewing is limited to permission granted sections...
PDF Printer - The PDF Printer is a simpler version of the PDF3Generator. The PDFPrinter lacks support for generating tables and TOC (Table of Contents). To create a PDFPrinter, pass a File object or a FileOutputStream to the constructor. It is important to close the PDF stream after printing. Otherwise, the PDF file may not be complete. The PDF output can be closed by either calling the end() method on the PrintJob object returned by the PDFPrinter, or by calling the close() method on the PDFPrinter directly. There are a few options that control how PDF files are generated. By default, text and images in a document are compressed. Since InetSoft products only support Zip compression, the generated document requires Acrobat Reader version 3.0 or later. If the PDF file needs to be compatible with earlier versions, the compression can be turned off manually. Note: The compression needs to be turned off for CJK operating systems. Otherwise some of the binary data will be corrupted in the PDF file.If compression is turned off, you risk the possibility of a large PDF file. This is especially true if you use images or painters in a report...
PDF Report Creation-servlet Web Interface API - Web-based reporting uses a web browser as the client viewer, presenting reports in either HTML or PDF format. InetSoft Enterprise products provide a complete solution using a mix of DHTML and PDF output. For purely static reports, it is possible to use PDF as the only presentation media. This is supported by a built-in servlet in the InetSoft package. The PDFService class supports web PDF, Excel and HTML generation. PDFService is a servlet based on standard servlet API. It can be deployed in any Servlet 2.0 compatible web server or servlet engine. By using the PDF servlet, an application can provide web based reporting without any programming effort. The PDF servlet can execute any report template produced using the Report Designer and can generate PDF and HTML output from the executed reports. File generation is performed in the background using background Java threads. Therefore, it is capable of handling multiple simultaneous requests and is not restrained by browser time-out when executing large reports. The flow of the PDF servlet is as follows...