Webinar on New Interactive Dashboard Features in InetSoft's 10.0 Release
Business intelligence software provider to host Webinar demonstrating new visualization and dashboard capabilities
Piscataway, NJ - January 26, 2009 - InetSoft Technology (www.inetsoft.com), an innovator in dashboard, reporting and analysis solutions, today announced a free Webinar to demonstrate new visualization and dashboard capabilities available in its recently released application, Style Intelligence 10.0.
All are invited to register at https://www2.gotomeeting.com/register/338126337 to attend a 30-minute Webinar on January 28th at 2:00PM Eastern. Registrants who are unable to attend live will receive notification to view the archived recording of the Webinar when it is available.
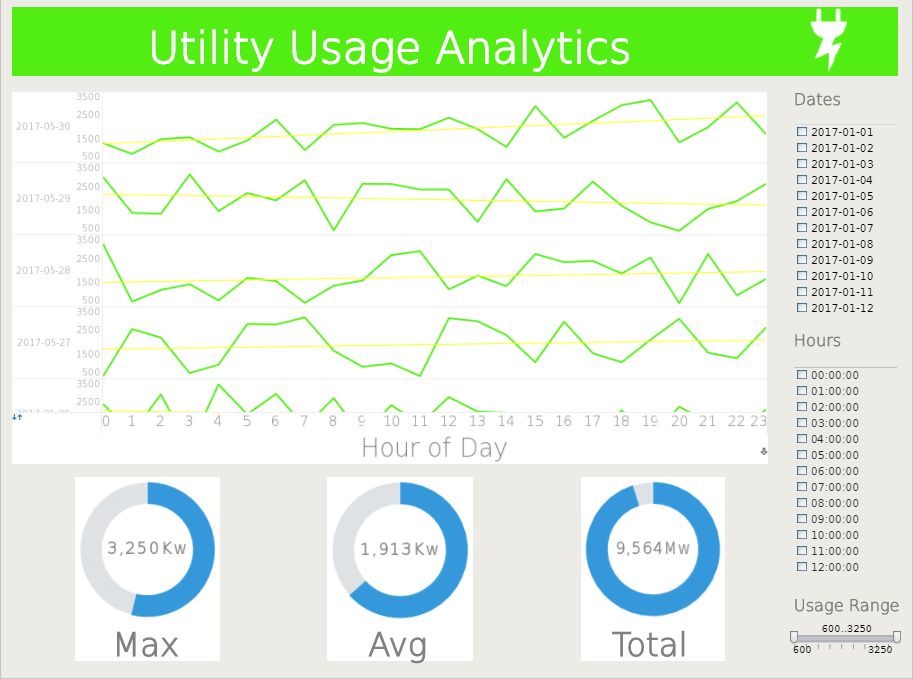
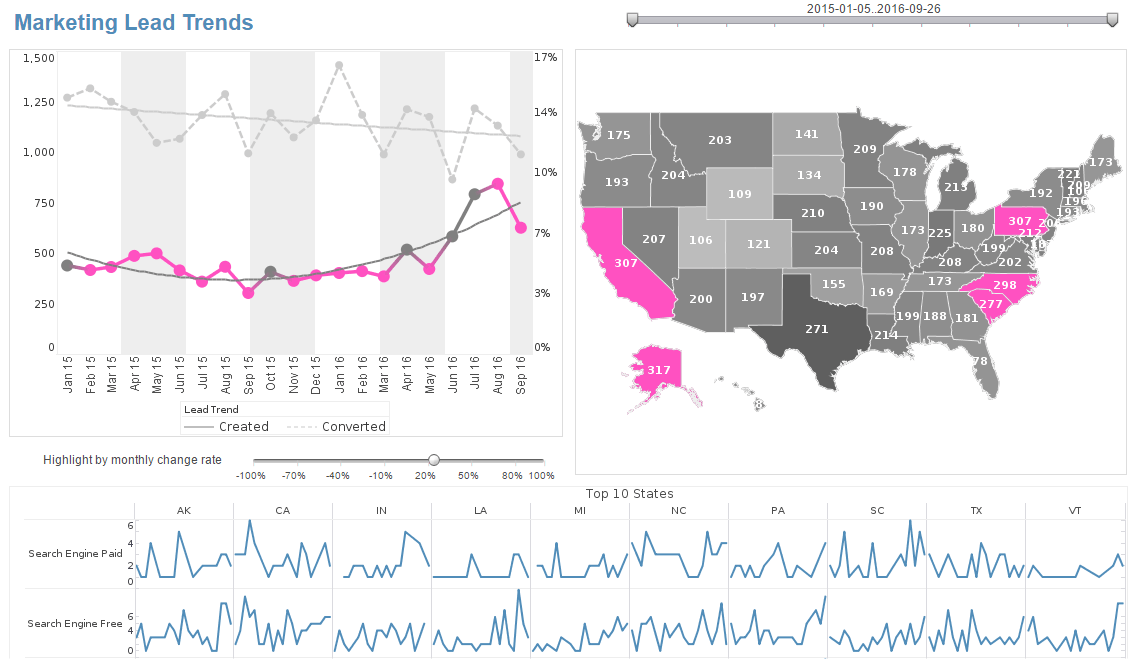
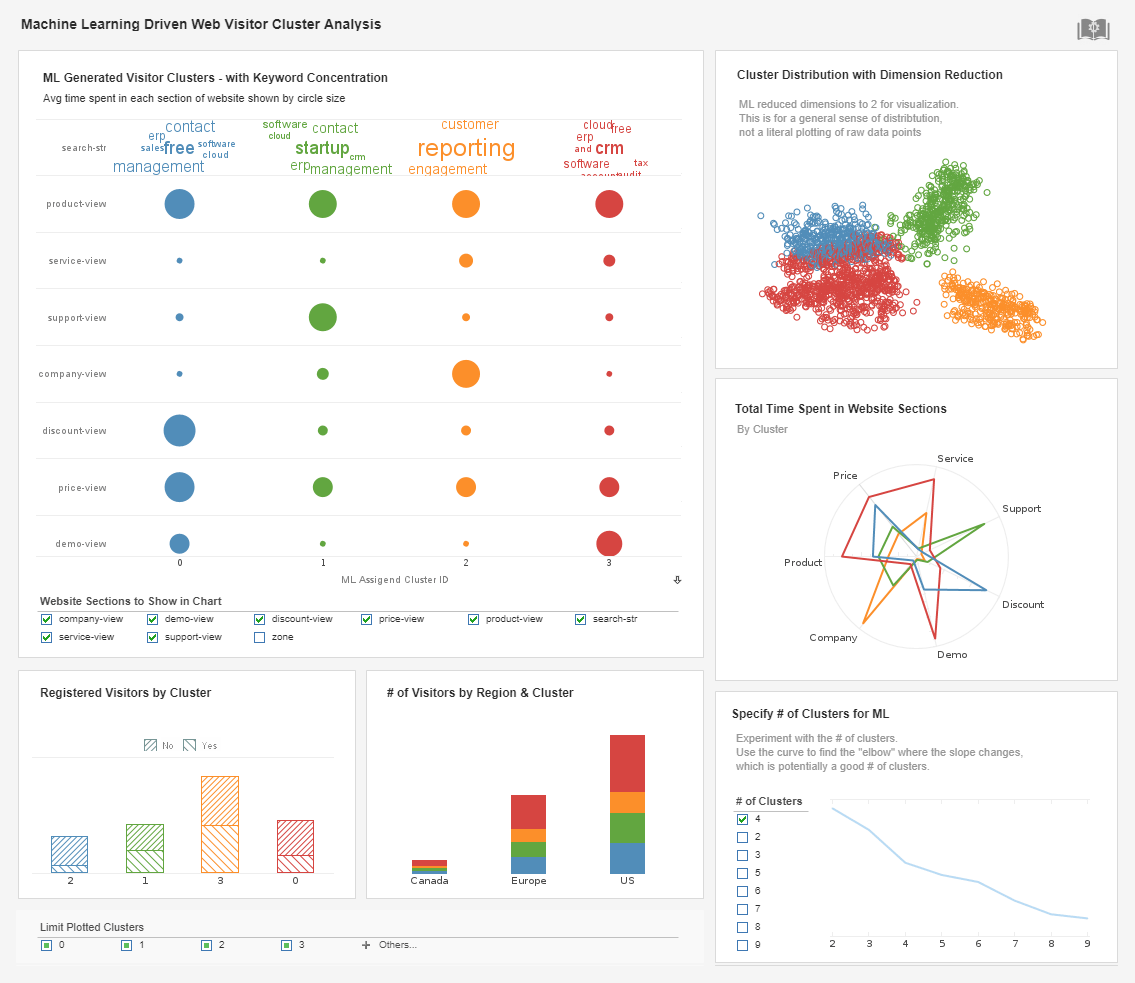
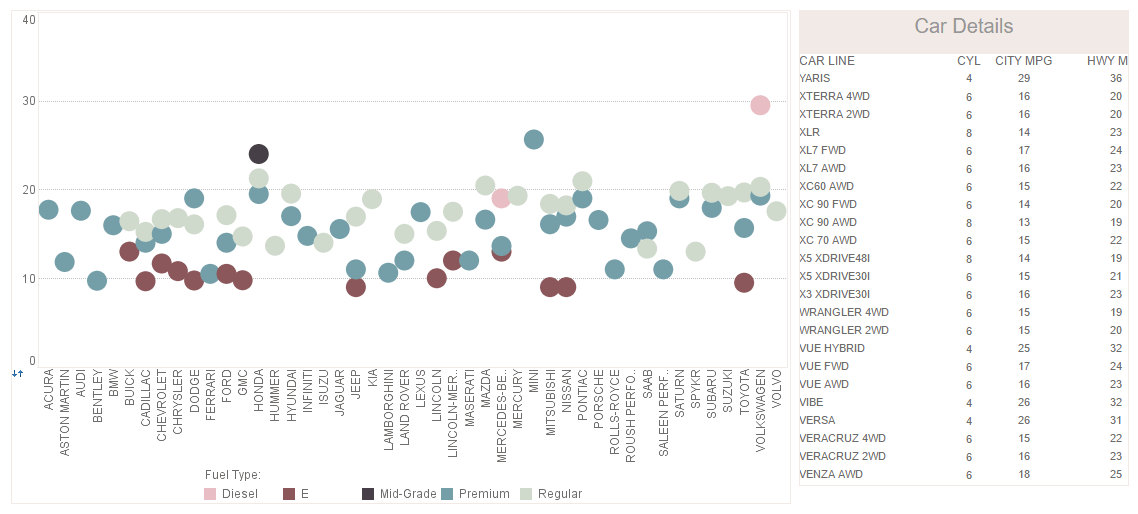
The major advances to be demonstrated are in the area of dashboards and visual analysis that provide:
- More impactful and visually appealing charts
- Greater information-richness thanks to new data dimensions of color, size & shape
- More interactivity to explore trends and relationships with new "brushing" capability
The net benefit for organizations is greater productivity for analysts and business users who can see more information in one interactive dashboard than would have taken dozens of screens or reports with less advanced solutions. The increased abilities for data slicing and dicing also translate into IT resource savings associated with less custom report requests.
"This release is a great step forward in the effort to make business intelligence software work better for both its producers and consumers," states Mark Flaherty, Vice President of Marketing at InetSoft. "By consumers, we mean the business end-users and even executives who want visually appealing charts and dashboards that are flexible enough to satisfy 90% of their information needs, but do not want to read manuals or take BI training classes to use the application. By producers, we mean the IT organization that needs to satisfy the demands of end-users in a more efficient manner with a greater degree of self-service."
InetSoft has been delivering award-winning software for 8 years running, offering easy, agile, and robust BI solutions that make it possible for enterprises of all sizes to deploy a fully-featured business intelligence solution that is very quick to deploy and easy for end-users to adopt. Highlights of the software include visually-compelling and interactive dashboards and pixel-perfect report generation, scheduling, and bursting. InetSoft's patent pending Data Block™ technology enables direct access to any open standards source, which means a data warehouse is not necessarily required, and any data manipulations can be shared and re-used with a simple drag-and-drop design tool.
For an online demo and free evaluation software, please visit www.inetsoft.com.
About InetSoft
Since 1996 InetSoft has been delivering easy, agile, and robust business intelligence software that makes it possible for organizations and solution providers of all sizes to deploy or embed full-featured business intelligence solutions. Application highlights include visually-compelling and interactive dashboards that ensure greater end-user adoption plus pixel-perfect report generation, scheduling, and bursting.
InetSoft’s patent pending Data Block™ technology enables productive reuse of queries and a unique capability for end-user defined data mashup. This capability combined with efficient information access enabled by InetSoft’s visual analysis technologies allows maximum self-service that benefits the average business user, the IT administrator, and the developer. InetSoft solutions have been deployed at over 5,000 organizations worldwide, including 25% of Fortune 500 companies, spanning all types of industries.
Contact
For more information, media and analysts may contact:
Mark Flaherty
InetSoft Technology Corp.
+1.732.424.0400 x 936
mark.flaherty@inetsoft.com
www.inetsoft.com
Visualization Examples


