Cloud-Flexible Analytic Dashboard Software
Since 1996 InetSoft has been delivering easy, agile, and robust analytic dashboard software that makes it possible for organizations and solution providers of all sizes. Our sophisticated applications include visually-compelling and interactive dashboards that ensure greater end-user adoption plus pixel-perfect report generation, scheduling, and bursting.
StyleBI is a sophisticated analytic tool for business performance, that provides a different level of interactivity and dashboard appeal. While other vendors offer advanced tools for operational use only, our dashboard software provides easy access and employment to any and all users with unique and intuitive data mashup capabilities. This allows users to combine disparate data from a multitude of featured databases.
Enjoy cloud-flexibility to install the software on premise or at the infrastructure host of your choice and the geographic location of your choice.

KPI and Scorecard Solutions
As in all performance management software applications, scorecards are a well-defined method for monitoring, analyzing, and managing performance through metrics. Our full service analytical dashboard software provides a list of key performance indicators (KPIs) that compare current performance data against goals, quotas, and target trends. It also incorporates information on what action to take if the specified goals are not met. The key advantages are the added capacities for:
- Exception-based management
- Actionable business intelligence
- Exception alerts for associated KPI
Scorecards are an optimal solution for analyzing dashboard metrics, centralizing all the KPIs that would be included in a business or executive dashboard.
Dashboard Analytics Software Features
StyleBI is easy, agile and robust enough to be integrated into your existing system. Some key features are:
- Shared bookmarks
- Mobile BI - access dashboards and analyses from Web-enabled devices including Android-based tablets, smartphones, iPads, and iPhones
- All popular Web browsers supported - e.g., Chrome, Internet Explorer, Firefox, Safari
- Target-based balanced scorecards
- Alerts for exceptions or business-rule triggers
- OLAP access to applications such as Microsoft SQL Server Analysis Services, Hyperion ESSbase, Oracle OLAP, and SAP NetWeaver
- Embedded BI - a Java-style API and multiple integration points allow developers maximum control over programmatic use of dashboarding and reporting
Dashboards and Visual Analysis Features
- Drag & drop design, spreadsheet-like design
- Dual purpose input/output elements
- Views assembled from sub-level views
- Monitoring and analysis oriented views
- Export to Excel, PowerPoint, PDF, RTF-Word, CSV, PostScript, Text, and SVG
- Unlimited multi-dimensional charting
- Drill down across views and into details
- Wide range of robust chart types including custom geographic mapping
- Visualization view re-use and collaboration
Data Access and Mashup Technology
- Real-time data mashup Data Block™ architecture
- Professional atomic data block modeling tool
- Web based data mashup accessible by end users
- Security control at the data cell level for users, roles and groups
- Agile mashup across multiple domains and multiple data sources
- High performance scalability for large data sets, and large volumes of users
Fluorspar Mining Company Switches from Matomo to InetSoft’s Cloud-Flexible Analytic Dashboard Software
In the complex world of mineral extraction, data is as valuable as the ore itself. Fluorspar mining companies face challenges that range from tracking production metrics across multiple sites to monitoring supply chain performance and environmental compliance. Traditionally, some mid-sized mining firms relied on Matomo, a self-hosted analytics platform, to manage operational data and website traffic analytics. While Matomo offered foundational capabilities, limitations in scalability, advanced dashboarding, and resource overhead became apparent as the company grew. In response, the Fluorspar miner transitioned to InetSoft’s cloud-flexible analytic dashboard software, a move that transformed data management and operational insight.
Limitations of Matomo for Mining Operations
Matomo, while robust in website analytics, is limited when applied to industrial contexts such as mining operations. Its dashboards are primarily focused on web traffic, user behavior, and basic metrics reporting. Fluorspar mining requires multi-dimensional dashboards that integrate production data, logistics metrics, energy consumption, environmental monitoring, and real-time supply chain statistics. Matomo’s reporting capabilities were largely static, requiring frequent manual exports to build custom reports. This inefficiency increased the workload on IT staff and delayed actionable insights for operations and management teams.
Another challenge with Matomo was server and maintenance overhead. Being self-hosted, it demanded dedicated infrastructure, routine updates, security monitoring, and database optimization. Each production site often needed its own server deployment, increasing capital and operational costs. Additionally, IT teams were required to maintain data pipelines from production equipment and ERP systems into Matomo, a task outside Matomo’s native design. Over time, this created significant resource strain and distracted IT from strategic projects that could improve mining efficiency.

Why InetSoft’s Cloud-Flexible Solution Was Chosen
The decision to move to InetSoft’s cloud-flexible analytic dashboard software was driven by several operational and strategic factors. First, the cloud-ready architecture removed the need for multiple self-hosted instances. A single, centralized platform could now consolidate data from all mining sites, ERP systems, environmental monitoring tools, and logistics applications. This consolidated approach dramatically reduced server overhead and simplified IT maintenance.
Licensing flexibility was another critical factor. InetSoft’s model allowed the mining company to scale licenses based on user count and data complexity rather than deploying costly site-specific servers. Enterprise dashboards for management could be provisioned with full analytical capabilities, while operators and field engineers could access lighter dashboards for daily operational use. This tiered licensing approach optimized costs while ensuring that all stakeholders had access to the data they needed.
Integration and Data Mashup Capabilities
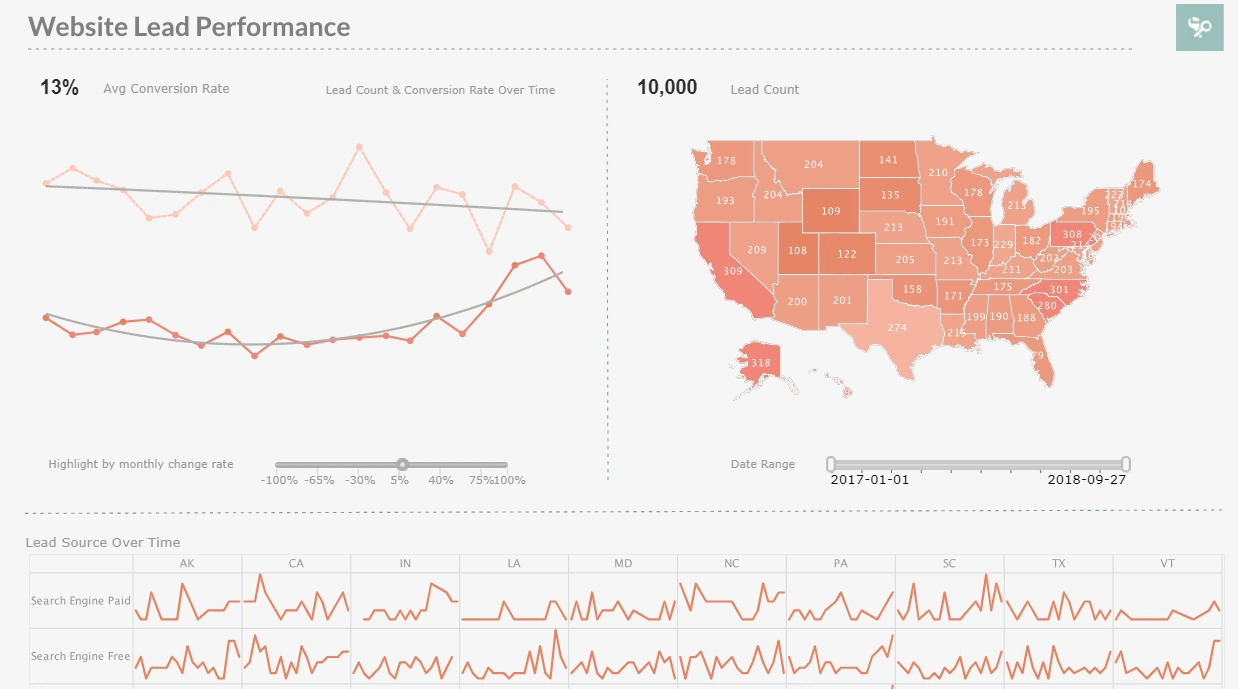
One of the standout features of InetSoft’s platform was its data mashup capabilities. Unlike Matomo, which primarily handles web-based analytics, InetSoft can integrate diverse datasets: production rates, energy usage, transportation metrics, chemical analysis results, and market pricing data. These data streams are automatically combined into unified dashboards, allowing real-time monitoring and predictive analytics. For example, operators can track production trends against energy consumption to identify inefficiencies, or management can visualize supply chain delays in context with inventory levels.
Integration also extended to advanced alerting and automated reporting. Whereas Matomo required manual report generation and distribution, InetSoft allowed automated delivery of dashboards to email or mobile devices based on thresholds and schedules. This functionality reduced the dependency on IT for routine reporting, freeing staff to focus on more strategic initiatives.
Resource and Overhead Savings
Moving to InetSoft significantly reduced IT resource strain. Previously, multiple IT staff were needed to manage servers, troubleshoot Matomo instances, and maintain custom reporting scripts. With a cloud-flexible deployment, server management responsibilities shifted to InetSoft, freeing internal IT resources. Maintenance windows, software patches, and security monitoring were now handled by the vendor, eliminating recurring overhead costs.
Energy consumption for multiple on-site servers also decreased, contributing to operational efficiency and environmental compliance. Reduced infrastructure footprint minimized the physical hardware lifecycle, lowering both capital expenditure and operational expenses. Additionally, the simplified architecture meant fewer points of failure, leading to improved system reliability and uptime.

Support and Vendor Services
Support was another area where the transition produced immediate benefits. Matomo’s community-driven support often meant slower response times and reliance on in-house expertise to solve complex problems. InetSoft, in contrast, provides enterprise-level support services, including dedicated account managers, technical consulting, and proactive system monitoring. When integration issues or analytical questions arose, the Fluorspar mining company could rely on vendor expertise rather than stretching internal resources. This responsiveness accelerated problem resolution and improved confidence among both IT and operational staff.
Impact on Management and End-User Satisfaction
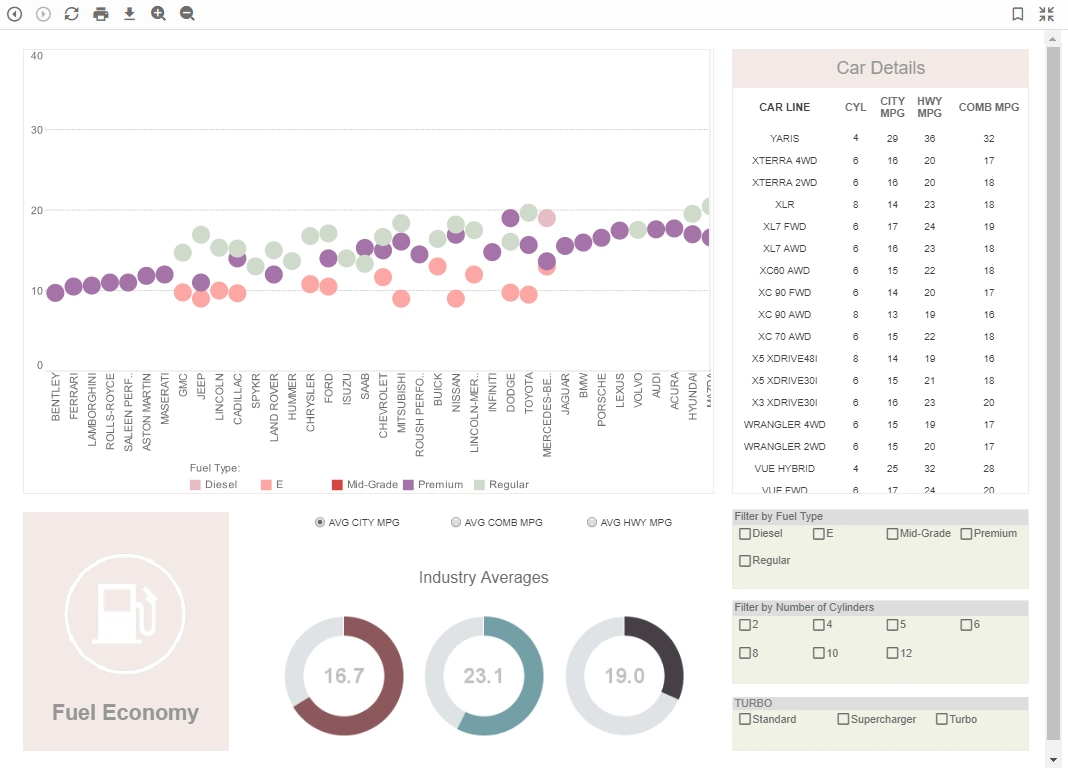
Management reported immediate improvements in decision-making capabilities following the transition. Previously, reports were delayed by hours or even days due to manual data collection and consolidation. InetSoft’s dashboards provided real-time visualizations of key performance indicators (KPIs), including extraction rates, energy efficiency, equipment utilization, and environmental compliance metrics. Managers could drill down into specific sites, production lines, or equipment units to identify bottlenecks and make proactive adjustments.
End-users, including operators and field engineers, also experienced heightened satisfaction. The intuitive dashboards allowed quick access to relevant data without requiring technical expertise. Interactive charts, trend lines, and alerts helped operators anticipate equipment issues, optimize production scheduling, and improve safety compliance. The reduction in manual report requests meant users spent more time on operational improvement rather than data gathering, fostering a culture of data-driven decision-making.
Quantifiable Benefits and ROI
From a financial perspective, the switch generated tangible savings. The reduction in server infrastructure, combined with tiered licensing, led to a noticeable decrease in IT expenditure. Resource reallocation allowed the IT department to focus on strategic projects, while automated reporting cut labor costs associated with report preparation and distribution. Early estimates suggested that within the first year, the Fluorspar miner achieved cost savings equivalent to 20–30% of previous analytics expenditures.
Beyond cost savings, operational performance metrics improved. Real-time dashboards enabled quicker response to production anomalies, reducing downtime and increasing throughput. Supply chain coordination improved as logistics and inventory data were integrated, preventing delays and stock shortages. Environmental compliance tracking became easier, lowering the risk of regulatory penalties. These improvements combined to produce measurable ROI, not only in cost reductions but also in operational efficiency and risk mitigation.

Future Directions
The migration to InetSoft also positioned the company for future growth. Cloud-flexible architecture allows easy onboarding of new sites or integration of additional data sources, including IoT sensor networks, predictive maintenance systems, and AI-driven analytics. The company is exploring advanced analytics models to forecast equipment failure, optimize extraction schedules, and predict market fluctuations for fluorospar pricing. The scalable platform ensures that as data volume grows, performance remains consistent, eliminating concerns about outgrowing the system.