Federal Budget Monitoring Dashboard
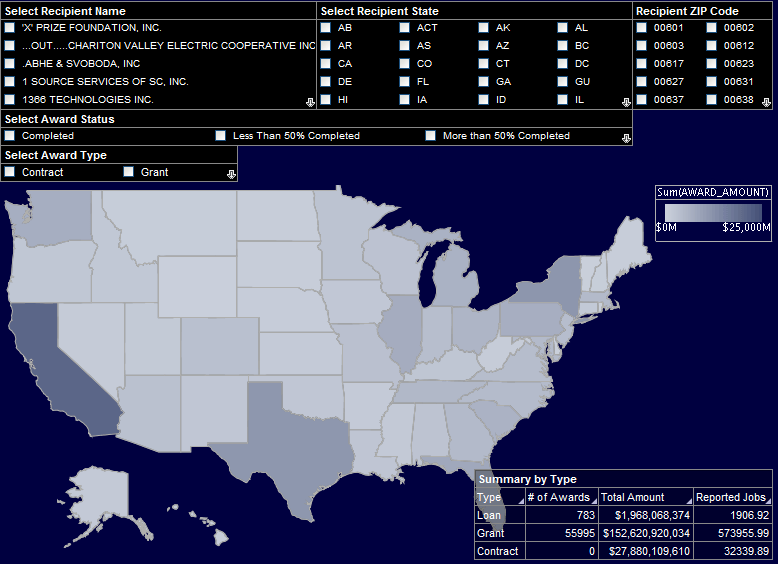
The Federal Budget Monitoring Dashboard below is an example of one of InetSoft's interactive web-based applications for federal agencies or departments. This particular chart allows users to monitor and research recipients of federal monetary funds by geography or type of award. With a point and click environment, users can drilldown into details by specific query such as state or population for an accurate analysis on one unified screen.
With InetSoft's easy-to-use drag and drop design tools, users can quickly build productive analytical tools like this one, that aid day-to-day operations, as well as keep track of and achieve long term goals and objectives. Federal agencies can remain ahead of the game knowing where monetary funds are.
InetSoft has a library of charts and visualization types to choose from, including geographic mapping, heat maps, and scatter plots. Executives can cater any completed dashboard to specific needs at any given time and even access them from mobile devices such as smartphones and tablets.
Compared to taking hours to find information through tedious spreadsheets or multiple databases, this visual analysis tool allows users to find information almost instantly on one screen.

Capabilities of InetSoft's Interactive Federal Budget Monitoring Dashboard:
- Filter by state, population, or specific query.
- Analyze charts and graphs and then select other tabs to see other views or drilldown into details.
- View data from multiple sources and formats on one dynamic screen.
InetSoft's StyleBI
The live Federal Budget Monitoring Dashboard has been deployed using StyleBI, a complete business intelligence solution. It is an easy to use and easy to deploy software that features a powerful data mashup engine for the creation of dashboards, visual analyses, and reporting. It is completely customizable so that each department and user has a unique solution to fit their needs.
StyleBI allows all users to upload and sift through multi-dimensional data to spot industry trends early or slice and dice data with simple point-and-click methods. Users also have the option to share their visual analysis with others, making communication fluid, or keep it private. StyleBI can assist federal bodies in keeping business and operations running smoothly.

How the U.S. Department of the Interior Uses StyleBI for Budget Monitoring and Decision Measurement
The U.S. Department of the Interior (DOI) manages a vast and diverse portfolio of responsibilities, from public lands and natural resources to Native American affairs and historic preservation. With such a broad mission, efficient allocation of financial resources and monitoring the impact of decisions and actions is critical. Historically, budget planning and performance measurement relied on traditional spreadsheets, static reports, and multiple disconnected systems. Recognizing the need for a more modern, integrated approach, the DOI has adopted StyleBI, an open-source analytics and dashboarding platform, to improve budget oversight, track expenditures, and measure the impact of policy and operational decisions.
The Challenge of Budget Management at DOI
The DOI’s annual budget covers a wide range of programs and agencies, including the National Park Service, Bureau of Land Management, U.S. Geological Survey, Bureau of Indian Affairs, and Office of Insular Affairs. Each unit has distinct funding requirements, project timelines, and reporting obligations. Tracking the flow of funds across hundreds of programs, grants, and operational projects is inherently complex.
Prior to adopting StyleBI, the DOI relied heavily on static reports generated from multiple financial systems. Budget analysts had to reconcile data from accounting software, grant management systems, and program-specific databases. This process was labor-intensive and prone to delays and errors. Additionally, decision-makers often lacked real-time visibility into how funds were being used, making it difficult to assess the effectiveness of expenditures or the outcomes of policy actions promptly.

Why StyleBI Was Chosen
StyleBI offered several advantages that aligned with the DOI’s needs for budget monitoring and decision measurement:
- Data Integration: StyleBI can connect to multiple financial, operational, and project management systems, enabling the consolidation of disparate datasets into a single, unified view.
- Real-Time Dashboards: The platform provides interactive dashboards that update automatically as new data becomes available, allowing managers to monitor budget execution and performance metrics in real time.
- Self-Service Analytics: Analysts and program managers can create and modify dashboards without needing extensive IT support, empowering units to track spending and performance independently.
- Open-Source Flexibility: Being open-source, StyleBI allows the DOI to customize dashboards and analytical models to meet the unique reporting requirements of federal agencies without incurring high licensing costs.
Implementation Across DOI Agencies
The DOI implemented StyleBI in phases to ensure smooth adoption and effective utilization across its agencies. The initial phase focused on consolidating financial data from core systems, including the DOI’s accounting and grant management platforms. Using StyleBI’s data mashup capabilities, analysts created unified data models that combined operational, programmatic, and financial information into a single analytical framework.
Once the data was consolidated, interactive dashboards were developed for key stakeholders:
- Budget Execution Dashboards: Provided executives and program managers with a high-level overview of allocated versus spent funds across all DOI agencies. Visual indicators highlighted under- or overspending, allowing rapid identification of areas requiring attention.
- Program Performance Dashboards: Linked spending to operational outcomes, enabling managers to assess the efficiency and effectiveness of programs. Metrics included project completion rates, resource utilization, and impact on conservation or community initiatives.
- Grant Monitoring Dashboards: Tracked federal grants awarded to tribal nations, non-profits, and state agencies. Dashboards displayed disbursement schedules, compliance status, and measurable outcomes of funded projects.
- Decision Measurement Dashboards: Integrated data on policy actions and operational decisions to measure their financial and programmatic impact, helping executives evaluate the return on investment for initiatives and guide future resource allocation.

Operational Benefits of StyleBI Adoption
The adoption of StyleBI has provided significant operational improvements for DOI:
- Improved Visibility: Decision-makers now have a real-time view of budget allocation, spending patterns, and program performance, eliminating the delays inherent in manual report consolidation.
- Enhanced Accountability: Dashboards allow executives to trace expenditures to specific programs and actions, ensuring that resources are used efficiently and in compliance with federal guidelines.
- Faster Decision-Making: With real-time dashboards and interactive visualizations, managers can identify budget issues or program inefficiencies immediately and take corrective action without waiting for monthly or quarterly reports.
- Reduced Administrative Burden: Analysts spend less time preparing reports and more time interpreting data and supporting strategic planning, increasing productivity across the department.
- Data-Driven Resource Allocation: By linking spending to outcomes, the DOI can prioritize funding for programs demonstrating measurable impact and adjust funding for underperforming initiatives.
Examples of StyleBI in Action
Several concrete examples demonstrate how StyleBI has transformed budget monitoring and decision measurement at the DOI:
- National Park Service Capital Projects: Dashboards track capital improvement projects, comparing projected versus actual costs, timelines, and completion milestones. Managers can drill down to specific sites to identify overruns or delays, enabling proactive resource adjustments.
- Energy and Mineral Development: StyleBI integrates data on royalties, leases, and permits to monitor revenue from resource extraction. Real-time dashboards help decision-makers evaluate the financial contribution of various projects and make informed policy or investment decisions.
- Tribal Affairs Grant Monitoring: The Bureau of Indian Affairs uses dashboards to oversee funding for tribal programs. Interactive visualizations track disbursement schedules, compliance with grant conditions, and the outcomes of funded projects, promoting transparency and accountability.
- Conservation and Wildlife Programs: Expenditure data is linked to conservation outcomes, such as species protection or habitat restoration. Managers can evaluate the effectiveness of spending, prioritize high-impact initiatives, and report results to Congress and the public.
Strategic Advantages and Long-Term Impact
The use of StyleBI provides the DOI with strategic advantages beyond operational improvements. By linking budgets to measurable outcomes, executives can make informed decisions that maximize the impact of federal resources. The department can also use predictive analytics to forecast spending trends, anticipate program shortfalls, and proactively plan interventions. Additionally, the platform supports scenario modeling, allowing managers to simulate the impact of different funding allocations on program outcomes, enabling data-driven decision-making in both short-term operational planning and long-term strategic initiatives.
Furthermore, StyleBI’s flexibility allows the DOI to integrate emerging data sources, such as environmental monitoring sensors, GIS data, and climate models, creating dashboards that combine financial, operational, and scientific insights. This integration supports evidence-based policy development and enhances the department’s ability to respond to complex challenges, such as climate change, natural disasters, and resource management conflicts.
Employee Engagement and Transparency
Another important benefit of StyleBI adoption is increased engagement and transparency. Analysts, program managers, and executives across DOI agencies can access dashboards tailored to their roles, providing relevant insights without overwhelming them with unnecessary detail. The self-service nature of the platform encourages staff to explore data independently, promoting a culture of accountability and data-driven decision-making. Transparency is also enhanced in external reporting, as the DOI can provide stakeholders, including Congress and the public, with clear, visually intuitive representations of budget allocation, spending, and program outcomes.

Implementation Lessons
Implementing StyleBI across a large federal agency provided several lessons:
- Start with Key Metrics: Focusing on critical budget and performance indicators ensures dashboards are immediately valuable to decision-makers.
- Data Standardization: Clean, standardized data is essential for accurate analytics, particularly when integrating multiple systems across different agencies.
- User Training: Providing training for staff on how to interact with dashboards and interpret analytics ensures the platform is used effectively and adoption is widespread.
- Iterative Deployment: Rolling out dashboards in phases allows the department to address technical challenges incrementally and gather feedback from users to improve usability and relevance.