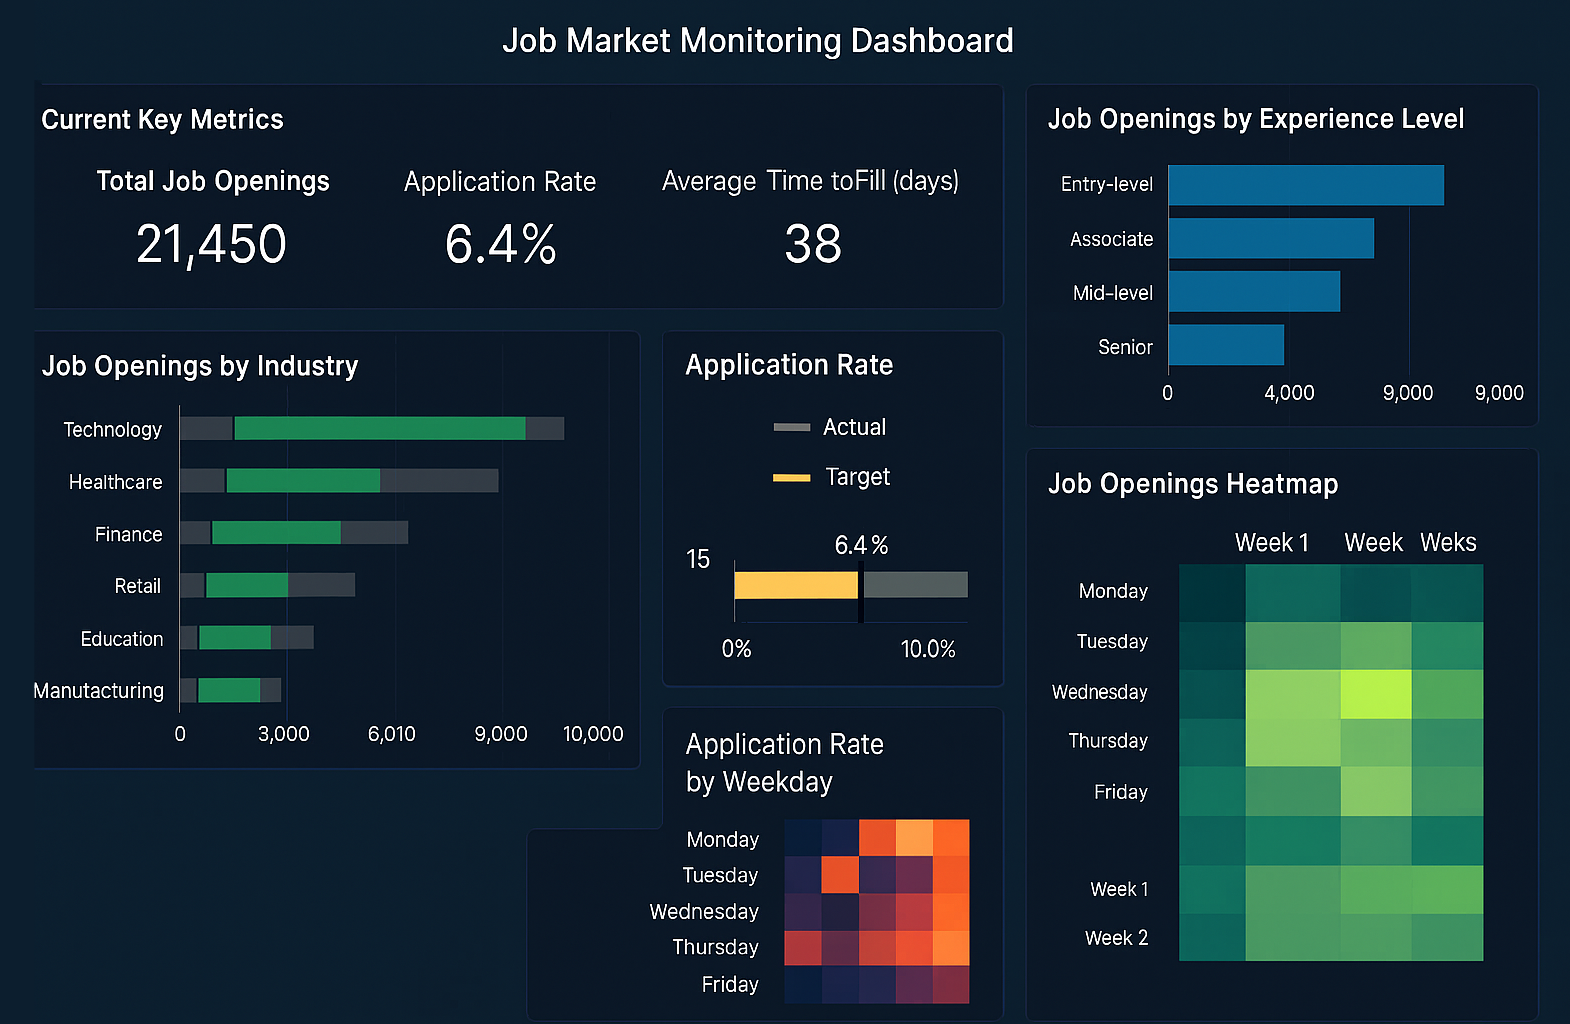
Job Market Monitoring Dashboard
This Job Market Monitoring Dashboard is a mock up example of interactive web-based applications for government agencies that InetSoft offers.
With InetSoft's easy-to-use, drag-and-drop design, government officials can quickly build productive analytical tools like this one that aid in day-to-day operations, as well as keep business running smoothly.
InetSoft has a library of charts and visualization types to choose from, including geographic mapping and scatter plots. InetSoft provides sophisticated data mashup so that goverment users can pull data from any source or location.
All end users can customize any dashboard to their specific needs at any given time and even access them from mobile devices such as smart phones and tablets.
Capabilities of InetSoft's Dashboard Software:
- Filter by specific queries such as state, population, industry or company.
- Analyze charts and graphs and then select other tabs to see other views or drilldown into details.
- View data from multiple sources and formats on one dynamic screen.
InetSoft's StyleBI:
The live Job Market Monitoring Dashboard has been deployed using StyleBI, a complete business intelligence solution. It is an easy to use and easy to deploy software that features a powerful data mashup engine for the creation of dashboards, visual analyses, and reporting. It is completely cusomtizable so that each company and user has a unique solution to fit their needs.
StyleBI allows all users to upload and sift through multi-dimensional data to spot industry trends early or slice and dice data with simple point-and-click methods. Users also have the option to share their visual analysis with others, making communication fluid throughout the agency, or keep it private. Style Intelligence can aid governmental agencies in achieving short term and long term goals by bringing crucial information to life on a real time monitoring and analysis screen.

-
Industry KPI Resources
Explore a comprehensive collection of KPIs and metrics tailored for different industries and departmental functions. This resource covers a wide range of sectors, including manufacturing, retail, finance, and more. It provides insights into the most commonly tracked KPIs, helping organizations benchmark their performance effectively. Whether you're in operations, sales, or HR, this guide offers valuable information to enhance your KPI tracking strategy.
-
KPI Analytics for Manufacturing Operations Analysts
Delve into the key performance indicators and analytics that manufacturing operations analysts use to promote operational success and continuous improvement. This article examines metrics such as Overall Equipment Effectiveness (OEE), cycle time, and throughput. It highlights how these KPIs help in identifying bottlenecks, optimizing workflows, and enhancing productivity. Understanding these metrics is crucial for driving efficiency in manufacturing processes.
-
Key Performance Indicators Dashboards
Learn about the importance of KPI dashboards in tracking an organization's performance and determining whether business goals are being met. This resource discusses how dashboards provide dynamic, easy-to-understand visual displays of an organization's most important metrics. It emphasizes the role of drill-down capabilities in enabling users to focus on critical information. Implementing effective KPI dashboards can significantly enhance decision-making processes.
-
KPIs and Analytics for Investment Operations Analysts
Explore the key performance indicators and analytics that investment operations analysts use to evaluate portfolio performance and manage risk. This article covers metrics like Return on Investment (ROI), risk-adjusted returns, and portfolio diversification. It discusses how these KPIs assist in making informed investment decisions and optimizing asset management strategies. Understanding these metrics is essential for achieving financial success in investment operations.
-
Fund Management Dashboard KPIs
Discover the key performance indicators that make up a fund management company's dashboard, guiding investment strategies and promoting financial success. This article examines metrics such as Asset Under Management (AUM) growth, information ratio, and ROI. It highlights how these KPIs help fund managers assess performance and make data-driven decisions. Implementing these metrics can lead to more effective fund management practices.
-
KPIs and Analytics by Billing Operations Analysts
Understand the key performance indicators and analytics that billing operations analysts use to ensure smooth billing processes and identify areas for improvement. This article discusses metrics like billing accuracy rate and invoice error rate. It emphasizes how these KPIs enable analysts to assess performance and make data-driven decisions. Monitoring these metrics is crucial for maintaining efficiency in billing operations.
-
FMCG KPI Dashboard
Learn about the key performance indicators to monitor in the fast-moving consumer goods (FMCG) sector. This resource discusses metrics such as average time to sell, which is crucial for handling perishable products. It highlights how tracking these KPIs can inform procurement plans and aid in inventory control. Implementing an effective FMCG KPI dashboard can enhance operational efficiency in this industry.
-
Selecting the Right Marketing KPIs
Discover tips for selecting the right marketing KPIs to measure the success of your campaigns. This article emphasizes the importance of using multiple KPIs to get a well-rounded view of marketing performance. It discusses the need to set realistic goals and periodically review KPIs to ensure they remain relevant. Utilizing data visualization tools can also help in tracking and understanding marketing KPIs effectively.
-
Key Performance Indicators
Explore InetSoft's library of key performance indicators and definitions by department and industry. This resource provides insights into the most important KPIs that organizations track, whether by department type or industry classification. It discusses how InetSoft's KPI tracking software can assist in monitoring and analyzing these metrics. Understanding these KPIs is essential for driving performance and achieving organizational goals.
-
Soft and Hard KPIs
Learn about the distinction between soft and hard KPIs and their applications in performance measurement. This article discusses how soft metrics rely on subjective assessments, while hard KPIs are precise and quantifiable. It emphasizes the importance of balancing both types of KPIs to get a comprehensive view of performance. Understanding this distinction can aid in selecting the appropriate KPIs for different contexts.

