Student Performance Dashboard
The student performance dashboard shown here is an example of the intuitive and powerful functionalities that InetSoft's user-friendly analytical dashboards provide organizations across all ranges. A leader in dashboard, reporting, and data mashup solutions, InetSoft offers a solution that is perfect for organizations in need of an easy-to-use, yet more-than-capable software that enhances business operations.
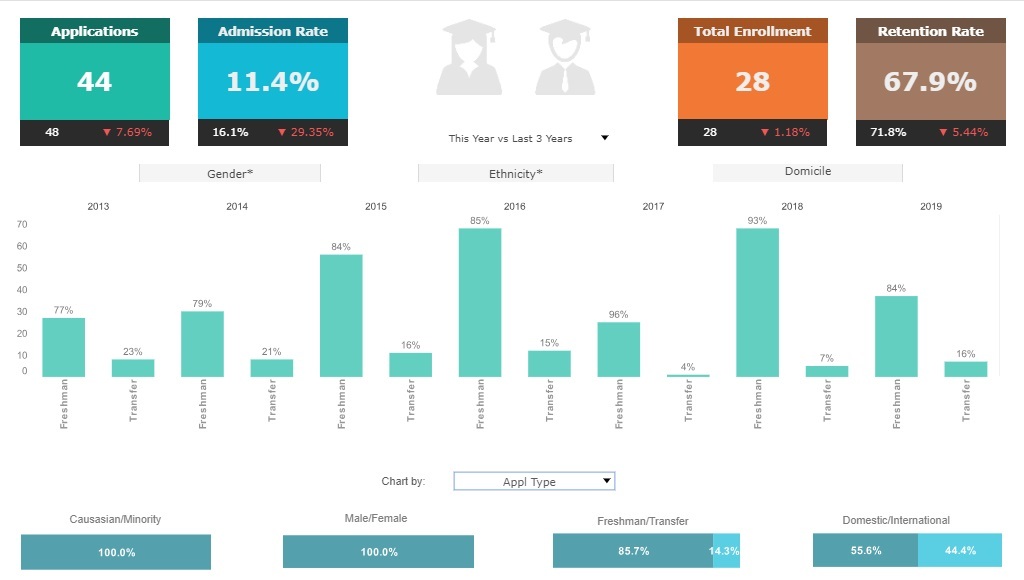
This particular chart exemplifies one of many available charts and visuals InetSoft has to offer along with fully customizable filtering/sorting options to magnify the analyzation process.
Users will also be empowered with great control over the search and analysis process with tools like range sliders, drop-down bars, radio buttons, and combo boxes to filter amongst special education students, English speaking students, specific students, attendance, and assignment/assessment scores to paint a clearer picture.
InetSoft's visualization software combines ease of use with detailed tools and features to help users in day-to-day operations, as well as help them keep track of and achieve long term goals and objectives.

Capabilities of the Student Performance Dashboard
- Monitor, explore, and analyze by filtering and sorting desired information
- Easy to use, modify, and create charts and visuals
- Leverage user-driven data mashup
- Upload and sift through multi-dimensional data to spot trends and aberrations
- Slice and dice data with simple point-and-click method
- Share visual analysis with others

What KPIs and Metrics Are Tracked on a Student Performance Dashboard?
A student performance dashboard is a valuable tool used by educational institutions to monitor and evaluate the academic progress and achievements of students. It provides stakeholders, including teachers, administrators, and parents, with insights into student performance, attendance, behavior, and other relevant metrics. Some of the key performance indicators (KPIs) and metrics tracked on a student performance dashboard include:
-
Academic Grades: Tracking students' academic grades across various subjects and courses provides insights into their academic performance and progress over time. Metrics may include average grades, grade distributions, and trends in performance.
-
Assessment Scores: Monitoring scores on quizzes, tests, exams, and other assessments helps assess students' mastery of course content and identify areas for improvement. Metrics may include average scores, percentile rankings, and comparisons to class or school averages.
-
Attendance Rates: Tracking students' attendance rates helps identify patterns of attendance and absenteeism, which can impact academic performance. Metrics may include overall attendance rates, tardiness rates, and trends in attendance over time.
-
Behavior Incidents: Recording behavior incidents such as disciplinary actions, referrals, suspensions, or other behavioral infractions provides insights into students' behavior and social-emotional well-being. Metrics may include the number of incidents, types of incidents, and trends in behavior over time.
-
Student Progress: Monitoring students' progress towards academic goals, learning objectives, or competency standards helps assess their overall development and growth. Metrics may include progress towards graduation requirements, completion of milestones, or mastery of specific skills.
-
Learning Engagement: Assessing students' engagement in learning activities, participation in class discussions, completion of assignments, and interaction with educational materials provides insights into their level of involvement and interest in learning. Metrics may include participation rates, completion rates, and quality of participation.
-
Learning Outcomes: Evaluating students' achievement of learning outcomes or educational standards helps assess the effectiveness of instructional strategies and curriculum design. Metrics may include proficiency levels, mastery of learning objectives, and alignment with academic standards.
-
Student Satisfaction: Gathering feedback from students on their satisfaction with educational experiences, instructional quality, support services, and school climate provides insights into their overall satisfaction and engagement. Metrics may include satisfaction surveys, ratings, and qualitative feedback.
-
Support Services Utilization: Tracking students' utilization of support services such as tutoring, counseling, academic advising, or special education services helps assess their level of support and intervention needs. Metrics may include service utilization rates, types of services accessed, and outcomes of support interventions.
-
Graduation and Dropout Rates: Monitoring graduation rates and dropout rates provides insights into students' persistence and success in completing their academic programs. Metrics may include cohort graduation rates, dropout rates, and trends in graduation over time.

More Articles About Performance Dashboards
Access Large Data Sets - I am taking some of the data from the data window here and I am moving it simply over to our workspace. And so what I have done is I have actually looked at how many flights each airline has flown over the last 10 years, the number of record, and the number of flights. And I would like to point out I am working with 67 million rows on my laptop right now via our Data Grid Cache technology...
Data Cache Persistence Time - The 'Data cache timeout' controls the persistence (ms) of a dataset in the data cache. If the dataset is not used for the specified time period, it is removed from the cache. The default timeout is 30 seconds...
Define an EJB Data Source - Similar to the CORBA data source, requests in an EJB data source are created from the EJB home Java class. Therefore, the Data Modeler must be able to load the EJB home class file in order to analyze the methods...
Definition of Data Space - Data space refers to the full collection of all reporting resources (templates, registry files, etc.), stored together in SREE Home for ease of management. This section provides information on how to set up a data space and how to manage the resources in the data space...