Telecommunications Analytics and Dashboards
The telecommunications dashboard here is an example of one of InetSoft's interactive web-based BI application being used by a telecom company. This particular chart allows users to monitor and research mobile subscriptions information by geography. With a point and click environment, users can drilldown into details by specific query such as state or population for an accurate analysis on one unified screen.
With InetSoft's easy-to-use drag and drop design tools, telecommunications companies can quickly build productive analytical tools like this one, that aid users in day-to-day operations, as well as help them keep track of and achieve long term goals and objectives. For telecom operators with more complex requirements, working with an experienced telecom software development company can help integrate custom analytics dashboards with existing network management, billing, and customer management systems.

Capabilities of InetSoft's Interactive Dashboards
The telecommunications dashboard has been deployed using StyleBI, a complete business intelligence solution. It is an easy to use and easy to deploy software that features a powerful data mashup engine for the creation of dashboards, visual analyses, and reporting. It is completely customizable so that each company and user has a unique solution to fit their needs.
StyleBI allows all users in the company to upload and sift through multi-dimensional data to spot industry trends early or slice and dice data with simple point-and-click methods. Users also have the option to share their visual analysis with others, making communication fluid throughout the company, or keep it private. StyleBI can aid communication companies in improving business and sustaining a competitive edge in the industry.

Telecom Network Performance Dashboard
A Telecom Network Performance Dashboard helps telecommunications providers monitor network health, service quality, subscriber activity, and infrastructure performance from a single interactive view. Network operations teams, regional managers, service engineers, and executives use this type of dashboard to quickly identify performance issues, track service levels, and optimize network investments. By consolidating data from cellular towers, broadband infrastructure, mobile devices, and customer service systems, the dashboard provides a real-time picture of how the network is performing across regions and customer segments.
The dashboard shown above focuses on network performance across Germany, presenting critical metrics such as network availability, download speed, upload speed, and active subscribers. These key performance indicators provide an immediate understanding of overall network quality while supporting deeper analysis through interactive charts and geographic visualizations.
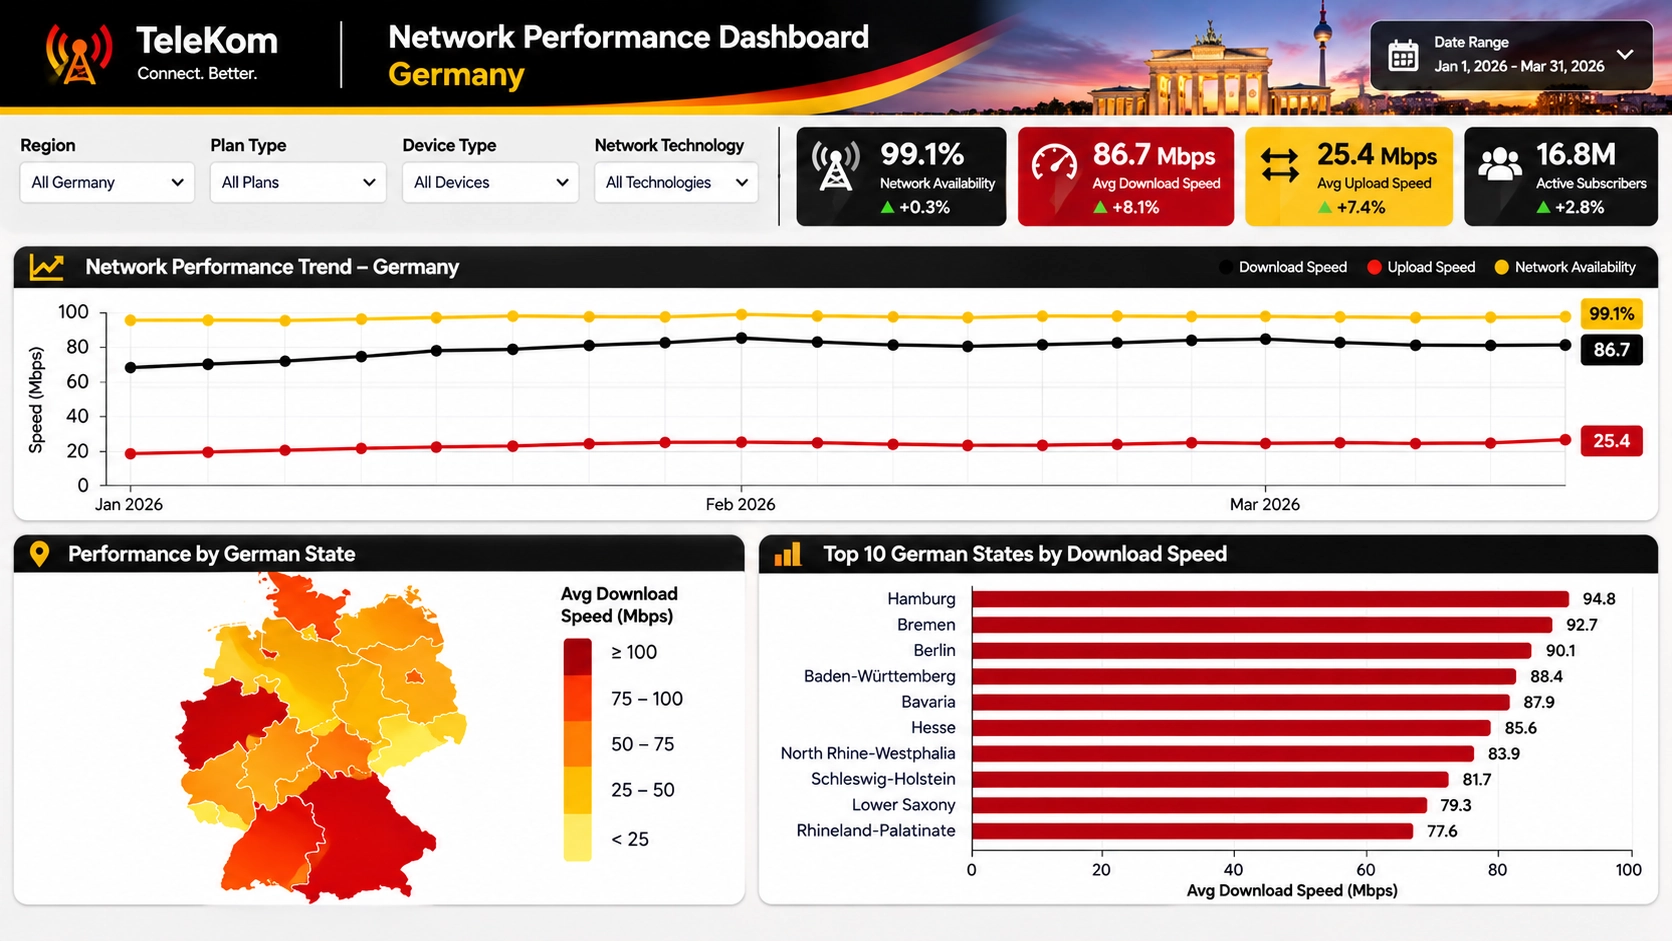
Executive KPI Summary
At the top of the dashboard are several KPI scorecards that provide an instant overview of network status. These metrics are designed to highlight both current performance and changes compared to previous periods.
- Network Availability: Measures the percentage of time network services are operational and accessible to customers.
- Average Download Speed: Tracks the average speed experienced by subscribers when receiving data.
- Average Upload Speed: Measures the efficiency of data transmission from users to the network.
- Active Subscribers: Shows the total number of customers actively using network services during the selected period.
Color coding and trend indicators allow users to immediately identify whether performance is improving or declining. Positive changes can be displayed in green while negative trends may be highlighted in red, enabling faster decision making.
Network Performance Trend Analysis
One of the most important components of the dashboard is the Network Performance Trend chart. This visualization tracks key network metrics over time, helping operators identify patterns, seasonal fluctuations, and emerging performance issues.
The trend chart typically contains multiple data series, including:
- Download speed trends.
- Upload speed trends.
- Network availability trends.
- Latency measurements.
- Packet loss percentages.
- Customer usage volume.
By displaying these measures on a single timeline, operators can determine whether changes in traffic volume are impacting service quality. Network engineers can use trend analysis to investigate performance degradation before customer complaints increase.
Geographic Network Performance Mapping
The geographic heat map provides a visual representation of network performance across states, provinces, or coverage areas. Color gradients quickly communicate regional differences in service quality and help organizations prioritize infrastructure improvements.
Common map-based metrics include:
- Average download speed by region.
- Network availability percentage.
- Coverage quality score.
- Subscriber density.
- Tower utilization rates.
- Service outage frequency.
Operations managers can instantly identify underperforming regions and determine whether poor performance is related to capacity constraints, equipment failures, or geographic coverage limitations.
Regional Performance Rankings
The dashboard includes a ranked bar chart that compares network performance across different states or service regions. This visualization highlights the highest and lowest performing locations and encourages data-driven improvement initiatives.
Regional rankings may include:
- Top regions by download speed.
- Top regions by customer satisfaction.
- Highest network availability areas.
- Regions with the fewest outages.
- Areas with fastest subscriber growth.
Managers can use these rankings to benchmark performance, identify best practices, and allocate resources to struggling regions where investments may have the greatest impact.
Subscriber Analytics
Telecommunications providers must understand not only how the network performs but also how customers use it. Subscriber analytics help organizations evaluate growth, engagement, and service adoption.
Key subscriber metrics often include:
- Total active subscribers.
- New subscriber acquisitions.
- Customer churn rate.
- Average revenue per user (ARPU).
- Data consumption per subscriber.
- Plan adoption by customer segment.
Combining subscriber information with network performance data helps reveal relationships between service quality and customer retention.
Network Operations Metrics
A comprehensive telecom dashboard also includes operational metrics that help engineering teams monitor infrastructure performance and maintain service reliability.
- Tower utilization percentage.
- Backhaul capacity usage.
- 4G and 5G coverage rates.
- Network latency.
- Packet loss volume.
- Dropped call rates.
- Equipment failure counts.
- Incident resolution times.
These metrics allow teams to proactively identify bottlenecks before service quality is affected. Automated alerts can notify operators when performance thresholds are exceeded.
Interactive Dashboard Features
Interactivity is critical for turning a static report into a powerful analytical tool. The dashboard provides multiple filtering and exploration capabilities that allow users to focus on the information most relevant to their responsibilities.
Common interactive features include:
- Region Filters:Analyze performance by country, state, city, or coverage zone.
- Plan Type Filters: Compare network quality across customer plans.
- Device Filters: Evaluate performance by smartphone, tablet, modem, or connected device.
- Technology Filters: Compare 4G, 5G, fiber, and broadband networks.
- Date Range Selection: Review performance over custom periods.
- Drill-Down Analysis: Move from national summaries to local network details.
- Hover Tooltips: Display additional context for specific data points.
- Cross-Chart Filtering: Selecting a region updates all related visualizations.
These interactive capabilities enable users to investigate issues quickly, uncover root causes, and gain deeper operational insights without requiring technical reporting expertise.
Business Benefits
A Telecom Network Performance Dashboard helps providers improve service quality, optimize network investments, reduce downtime, and enhance customer satisfaction. Real-time visibility into network conditions allows teams to respond faster to emerging issues while supporting long-term planning initiatives. By combining operational, subscriber, geographic, and performance data into a single analytical environment, telecommunications organizations can make faster decisions, improve reliability, and deliver a superior customer experience across their entire network.