Much has been spoken of data mashup by us here at InetSoft, with many writings throughout our website detailing its benefits and uses. However, many data management problems solved by data mashup can be hard to picture for those who don’t have in-depth experience in the field. This post will show a very basic use case that illustrates the utility of data mashup platforms and how data mashup apps can allow nontechnical users to be more independent of IT.
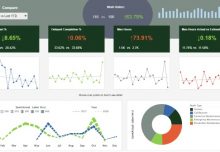
Let’s say that in your data warehouse you have a table of sales data that is updated daily. The table contains all kinds of sales details such as amount, product type, quantity, state etc. You begin constructing an executive dashboard for the CEO in which you would like to include a table that lists the top 5 states in terms of sales. But the table of sales data in your data warehouse only lists state initials for each sale, not the full state name. You could list the states by initials in the table, but you’d really prefer to list the full state names for better readability.
Do you put in a request to the database administrator to add a full name state column to the sales data table? It seems too trivial to add extra IT work, and even if you put in the request, will the update to the database be complete in time for you to complete your dashboard by the boss’s deadline?
If you’re using a BI platform ta hat enables data mashup from multiple sources (as InetSoft does) there’s a quick fix that you can do without needing administrator access to the data warehouse environment.
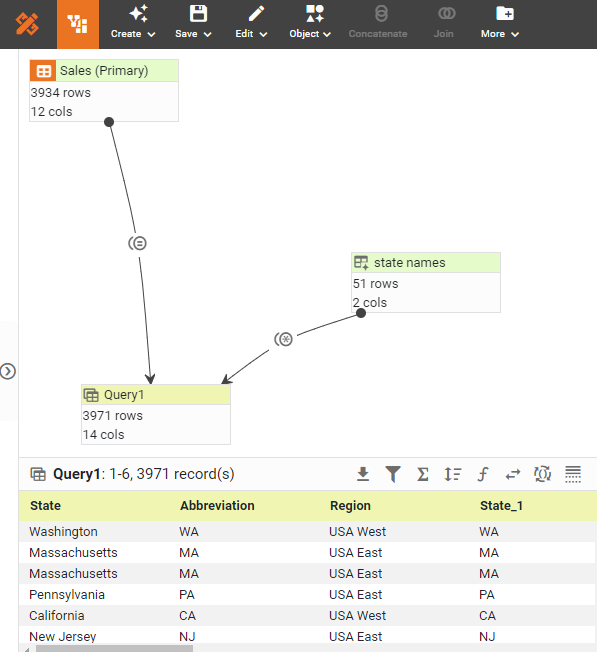
If you were using InetSoft’s mashup software here is where you would create a data worksheet featuring the sales database query you were using for you dashboard. Simply add an embedded table to the worksheet, into which you can upload a simple two column csv containing state names and state initials.
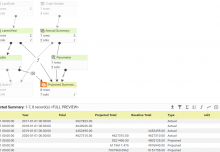
Then perform a left outer join to add a new column to the sales query, one in which the appropriate state name is added to each record based on the state initials listed. This creates a new query that features the sales data but with a state name for each record. This new query is then used to construct the dashboard.
The ability to perform joins on different tables based on shared columns is, of course, as old as SQL itself. But traditionally these joins are only performed with tables in the same database. What’s unique about doing this in a web-based data mashup environment is that no modification of the sales data at the source is necessary, and the existing mashup can be saved to be used in future dashboards as well.
Every time a dashboard built from the resulting data worksheet is loaded, fresh sales data will come into the worksheet from the database and have the state name column added to it.
Keep following the Mashup for more on data management, dashboard design, and machine learning.