About InetSoft
Since 1996 InetSoft has been delivering easy, agile, and robust business intelligence software that
makes it possible for organizations and solution providers of all sizes to deploy or embed
full-featured business intelligence solutions. Application highlights include visually-compelling and
interactive dashboards that ensure greater end-user adoption plus pixel-perfect report generation,
scheduling, and bursting. InetSoft's patent pending Data Block™ technology enables productive
reuse of queries and a unique capability for end-user defined data mashup.
This capability combined with efficient information access enabled by InetSoft's visual analysis
technologies allows maximum self-service that benefits the average business user, the IT
administrator, and the developer. InetSoft solutions have been deployed at over 5,000 organizations
worldwide, including 25% of Fortune 500 companies, spanning all types of industries.
Examples of Vertical-focused Cloud Based Applications That Need Better Reporting Features from InetSoft
Vertical-focused cloud-based applications are tailored to meet the specific needs of distinct industries or
sectors. These applications provide industry-specific functionalities, ensuring that businesses can operate
more efficiently and effectively within their particular domain. They often come with robust dashboard
reporting features that offer deep insights into key performance indicators (KPIs) relevant to that industry.
Here, we will explore several vertical-focused cloud-based applications, discussing the dashboard reporting
features built into each and the KPIs they include.
1. Salesforce Health Cloud
Industry: Healthcare
Overview: Salesforce Health Cloud is a patient relationship management (PRM) solution that enables healthcare
providers to deliver personalized care experiences. It integrates data from electronic health records (EHRs),
wearables, and other medical devices to provide a comprehensive view of patient health.
Dashboard Reporting Features:
- Patient Management Dashboards: Visualize patient data, treatment plans, and health progress.
- Operational Dashboards: Monitor clinic performance, patient wait times, and resource utilization.
- Compliance Dashboards: Track adherence to regulatory standards and patient data privacy.
KPIs Included:
- Patient Satisfaction Scores: Measure patient feedback and satisfaction levels.
- Appointment Adherence Rate: Track the percentage of kept appointments versus scheduled.
- Treatment Efficacy: Monitor outcomes and effectiveness of treatment plans.
- Resource Utilization: Assess how effectively medical resources (e.g., beds, equipment) are used.
- Regulatory Compliance Metrics: Ensure adherence to healthcare regulations and standards.
2. Oracle NetSuite for Retail
Industry: Retail
Overview: Oracle NetSuite for Retail is a comprehensive cloud-based solution that helps retailers manage
their operations, from inventory management to customer relationships. It offers a unified view of the
business, enabling better decision-making and improved customer experiences.
Dashboard Reporting Features:
- Sales Performance Dashboards: Track sales trends, revenue, and customer buying behavior.
- Inventory Management Dashboards: Monitor stock levels, inventory turnover, and demand forecasting.
- Customer Experience Dashboards: Analyze customer satisfaction, loyalty, and feedback.
KPIs Included:
- Sales Growth: Measure revenue growth over time.
- Inventory Turnover: Track how often inventory is sold and replaced.
- Gross Margin: Calculate the difference between sales and the cost of goods sold.
- Customer Lifetime Value (CLV): Estimate the total revenue expected from a customer over their relationship
with the business.
- Customer Satisfaction Scores: Gauge customer happiness and service quality.
3. SAP S/4HANA for Manufacturing
Industry: Manufacturing
Overview: SAP S/4HANA for Manufacturing is an integrated enterprise resource planning (ERP) solution that
supports manufacturing processes and operations. It provides real-time insights into production, supply chain,
and financial performance.
Dashboard Reporting Features:
- Production Dashboards: Monitor production schedules, efficiency, and output quality.
- Supply Chain Dashboards: Track supplier performance, inventory levels, and logistics.
- Financial Dashboards: Analyze cost structures, profitability, and financial health.
KPIs Included:
- Overall Equipment Effectiveness (OEE): Measure the efficiency of manufacturing equipment.
- Production Yield: Track the ratio of acceptable products produced to the total output.
- Supply Chain Lead Time: Assess the time taken for products to move through the supply chain.
- Cost per Unit: Calculate the total cost of producing one unit of a product.
- Order Fulfillment Rate: Measure the percentage of orders delivered on time and in full.
4. IBM Watson for Financial Services
Industry: Financial Services
Overview: IBM Watson for Financial Services uses artificial intelligence to enhance financial operations,
risk management, and customer service. It provides predictive analytics and insights to drive better financial
decisions.
Dashboard Reporting Features:
- Risk Management Dashboards: Identify and monitor financial risks and compliance issues.
- Customer Analytics Dashboards: Analyze customer behavior, preferences, and engagement.
- Operational Efficiency Dashboards: Track internal processes and operational performance.
KPIs Included:
- Credit Risk Exposure: Measure the risk associated with lending activities.
- Customer Churn Rate: Track the percentage of customers who leave over a given period.
- Operational Cost Ratio: Assess the cost efficiency of financial operations.
- Revenue per Customer: Calculate the average revenue generated per customer.
- Compliance Adherence Rate: Ensure conformity to financial regulations and standards.
5. Microsoft Dynamics 365 for Education
Industry: Education
Overview: Microsoft Dynamics 365 for Education is designed to support educational institutions in managing
student information, administrative processes, and engagement. It provides tools for student lifecycle
management and academic analytics.
Dashboard Reporting Features:
- Student Performance Dashboards: Track academic progress, attendance, and grades.
- Administrative Dashboards: Monitor administrative operations and resource allocation.
- Engagement Dashboards: Analyze student and parent engagement levels and feedback.
KPIs Included:
- Student Retention Rate: Measure the percentage of students who continue their studies each year.
- Graduation Rate: Track the percentage of students who complete their programs.
- Average GPA: Calculate the average grade point average of students.
- Resource Utilization: Assess the efficiency of resource use, such as classrooms and equipment.
- Engagement Scores: Evaluate the level of student and parent involvement in school activities.
6. HubSpot for Marketing Agencies
Industry: Marketing
Overview: HubSpot for Marketing Agencies provides tools for managing marketing campaigns, customer
relationships, and sales processes. It offers comprehensive analytics to optimize marketing strategies and
performance.
Dashboard Reporting Features:
- Campaign Performance Dashboards: Analyze the effectiveness of marketing campaigns across various channels.
- Lead Generation Dashboards: Track the number and quality of leads generated.
- Sales Conversion Dashboards: Monitor the sales funnel and conversion rates.
KPIs Included:
- Lead Conversion Rate: Measure the percentage of leads that turn into customers.
- Customer Acquisition Cost (CAC): Calculate the cost of acquiring a new customer.
- Return on Marketing Investment (ROMI): Assess the profitability of marketing campaigns.
- Engagement Rate: Track the level of engagement with marketing content.
- Click-Through Rate (CTR): Measure the effectiveness of digital marketing ads and content.
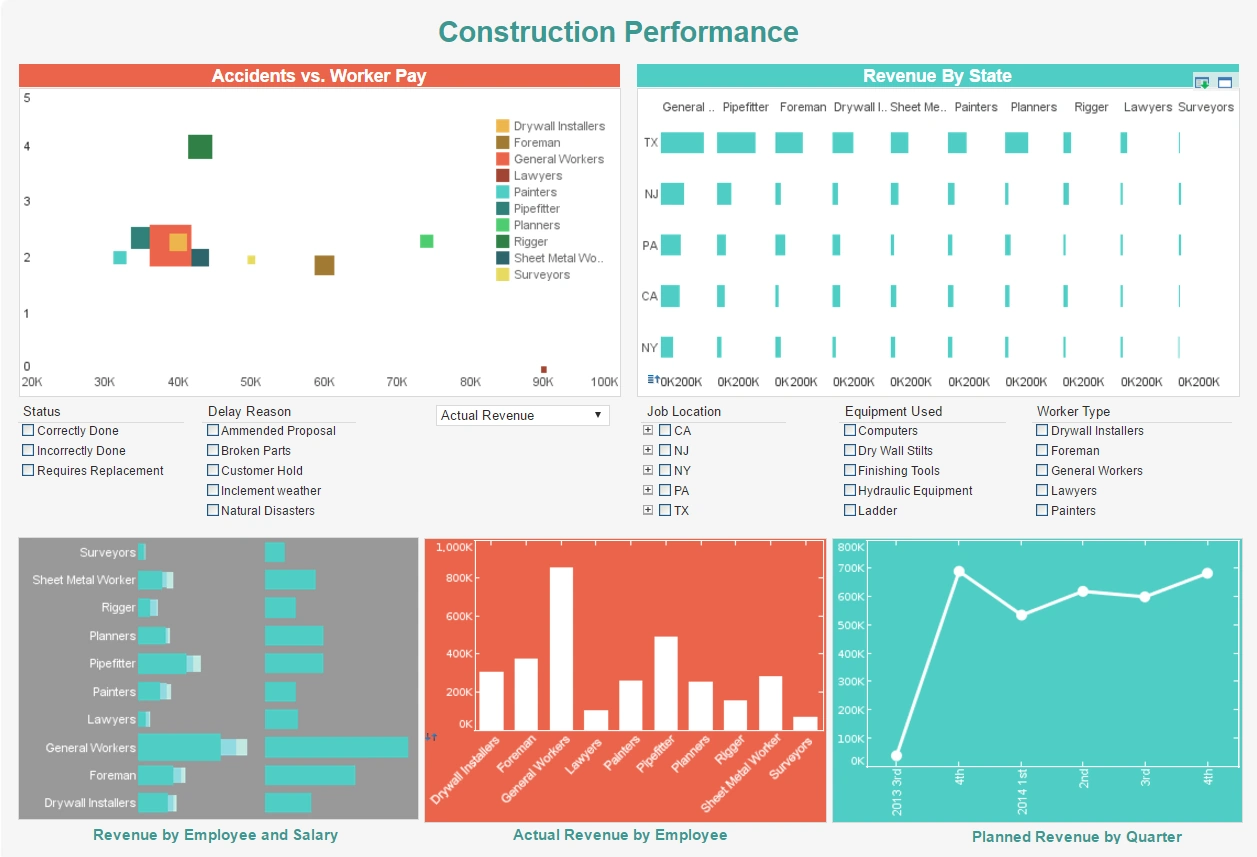
7. Epicor ERP for Construction
Industry: Construction
Overview: Epicor ERP for Construction is a cloud-based solution that helps construction companies manage
projects, resources, and financials. It provides detailed insights into project performance and operational
efficiency.
Dashboard Reporting Features:
- Project Management Dashboards: Track project timelines, milestones, and progress.
- Resource Management Dashboards: Monitor the allocation and utilization of labor and equipment.
- Financial Dashboards: Analyze project budgets, expenses, and profitability.
KPIs Included:
- Project Completion Rate: Measure the percentage of projects completed on time and within budget.
- Resource Utilization Rate: Track the efficiency of labor and equipment use.
- Cost Variance: Calculate the difference between budgeted and actual project costs.
- Profit Margin: Assess the profitability of construction projects.
- Safety Incident Rate: Monitor the frequency of safety incidents on construction sites.
More Articles About SaaS Reporting
Report Builder Information - Looking for report builder software? Since 1996, InetSoft has been providing
award-winning reporting software for enterprises and developers. View a demo. Free eval download. Read
articles below for more information...
Resources for Self-service Maximization - Don't want to be saddled with a massive BI software deployment
that hogs resources and demands a major hardware investment? Self-service business intelligence enables
businesses to make decisions quickly and more effectively. This is because it allows end users to create their
own reports using the data available in the system. Self-service BI also helps save time and resource costs by
taking away the need for IT staff members and other business intelligence experts who would otherwise have
been required to handle this task...
Tool to Make Contour Charts Online for Free - To easily and quickly create Contour Charts online for
free, create a Free Individual Account on the InetSoft website. You will then be able to upload a spreadsheet
data set. Once you have done that, you will be able to proceed past the Visualization Recommender, which can
usually get you started creating a dashboard. Since the Recommender does not suggest Contour or Contour Map as
an option, press the Full Editor button...
Transforming a Generic Schema - A physical view's design should transform a generic schema into a
business intelligence-friendly schema. Even though the physical view is not directly accessed by end users,
its design impacts the logical model, which is accessed by end users...