InetSoft's Dashboard Web App
Looking to view and/or build dashboards via a web app? InetSoft's dashboard web application can be installed either on-premise or in the cloud, on a remote server provided by Amazon web services or any other provider.
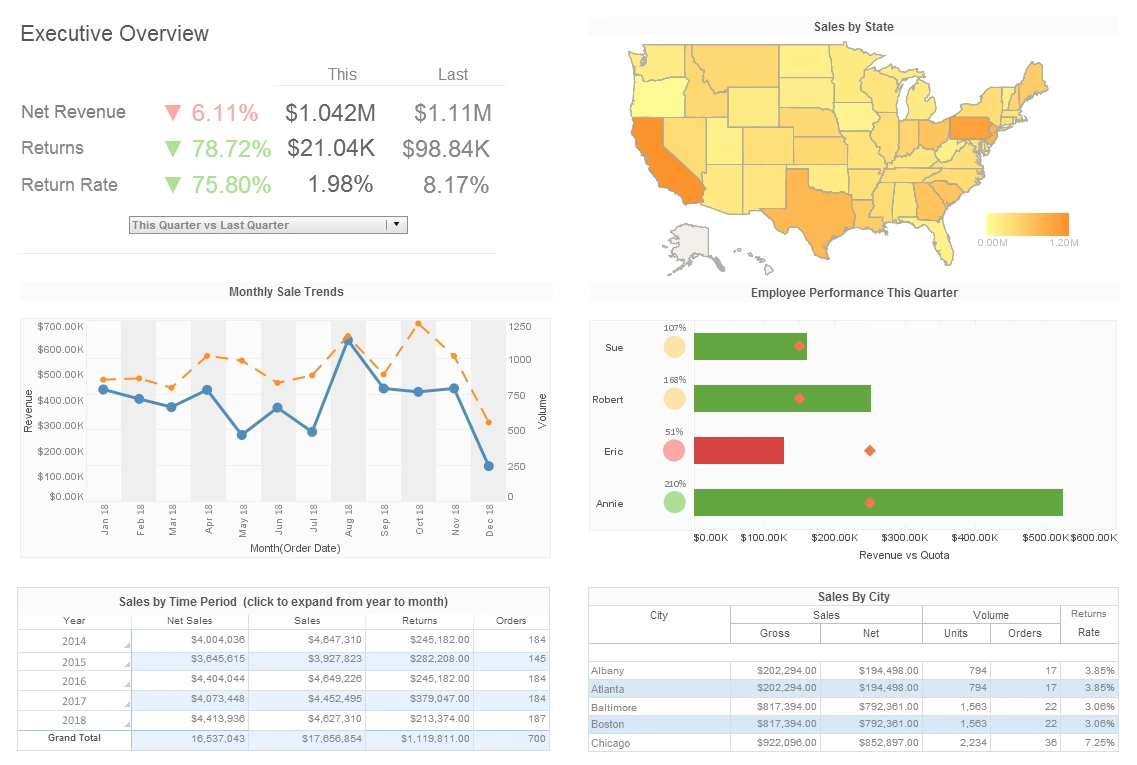
A dashboard is a visual display of the most important and relevant information in reference to one or more objectives, displayed on one screen so it can be viewed easily at a glance. Dashboard software has been proven to be a highly effective business intelligence tool for business users and casual users alike.
Whether examining future business trends or looking for a way to analyze information in a more effective way, dashboards allow users the ability to not only monitor and analyze data, but also manipulate data in order to meet the demands of even the most sophisticated user.
InetSoft offers a dashboard web application in a zero-client, 100% web-based environment. A web-based dashboard app allows for ease of use and maximum-self service without having to rely on the IT department. Any user with a basic understanding of Excel can easily deploy pixel-perfect dashboards in just a few simple clicks.

InetSoft's dashboard software uses a visualization-driven approach to dynamically display and report important pieces of data from the web application. Once deployed, users can use unique dashboard drill down features to get more information about or isolate a particular piece of data.
A web-based dashboard app also means that the dashboard can be accessed from anywhere on a web browser, whether installed on your machine, on a remote server miles away or at a server in the company's local intranet.

Real-Time Data Access and Mashup
Using a web-based dashboard application offers many advantages to the user, including the ability to access the most up-to-date data at any time. With data constantly changing, data even a few hours old can be out of date, and waiting on IT for complicated updates causes unnecessary delays in accomplishing tasks. This means that dashboard web apps must offer more self-service for users. As business demands increase, users can't wait for IT to make changes in data sources or wait for IT to adjust the dashboards to present new types of data or to use data in a different way.
With InetSoft's dashboard web app, data access takes place in real-time by default, which means lag time and delays waiting for complicated updates can be a thing in the past. Not having to rely so heavily on IT makes for maximum self-service, allowing users to ask unlimited questions of their data with no wait time.
Using this dashboard application, users can also access almost any database to seamlessly extract data from multiple sources at once. Information can be integrated from relational databases such as Oracle, SQL Server, PostgreSQL, and MySQL via a JDBC driver, multidimensional databases, salesforce.com, Microsoft Excel spreadsheets, Hadoop/HIVE, Google Adwords and Analytics, SAP, and many more. The ability to combine and analyze data from previously disparate sources give users the ability to spot future trends and new correlations.
Interactive Dashboard App Features
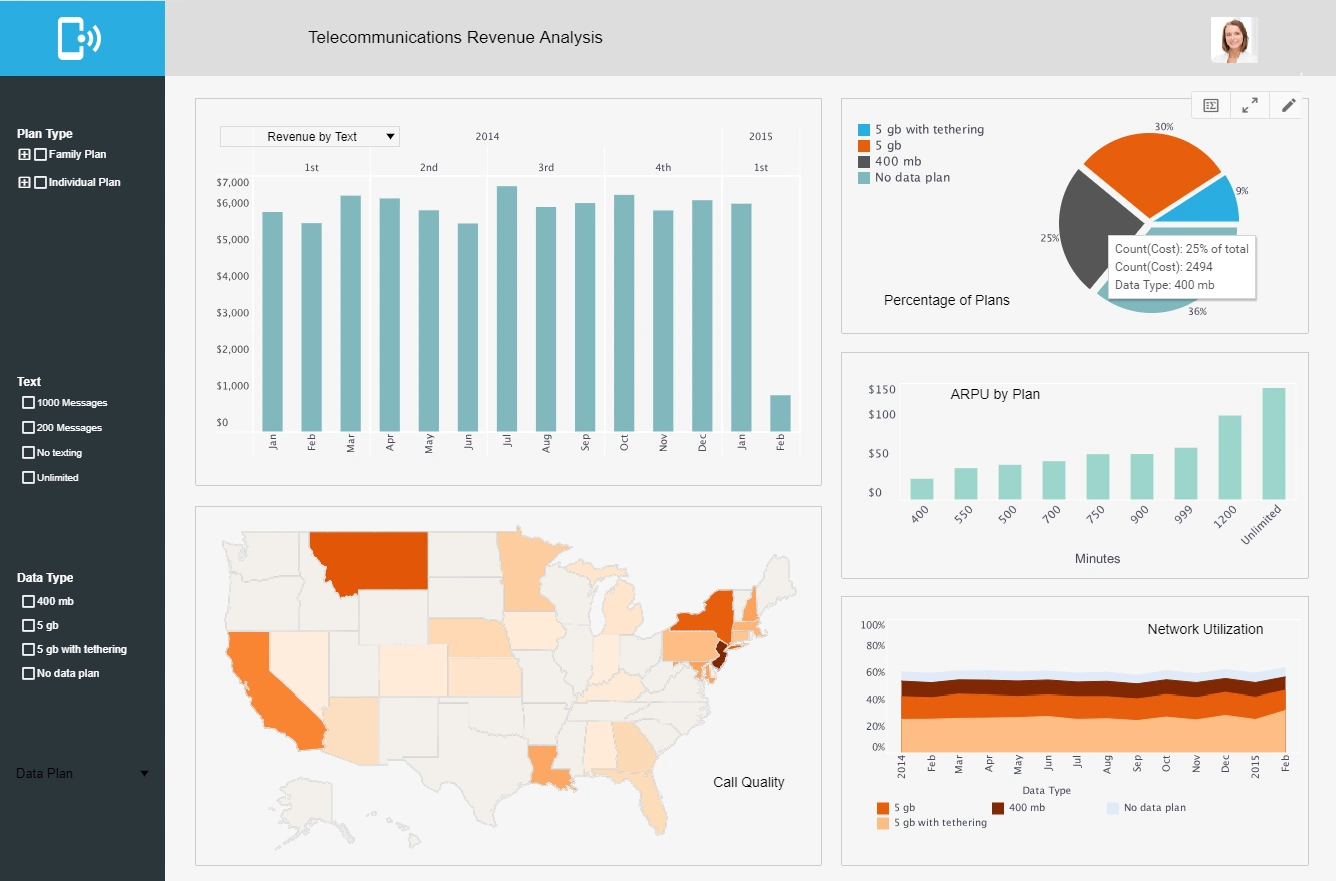
InetSoft's self service also extends to exploring data with visual interactivity. The dashboard web app allows users to not only create compelling visuals, but also to explore the information through interactive dashboard features without complicated programming. This allows for a new level of exploration and insight into data for users, regardless of skill level.
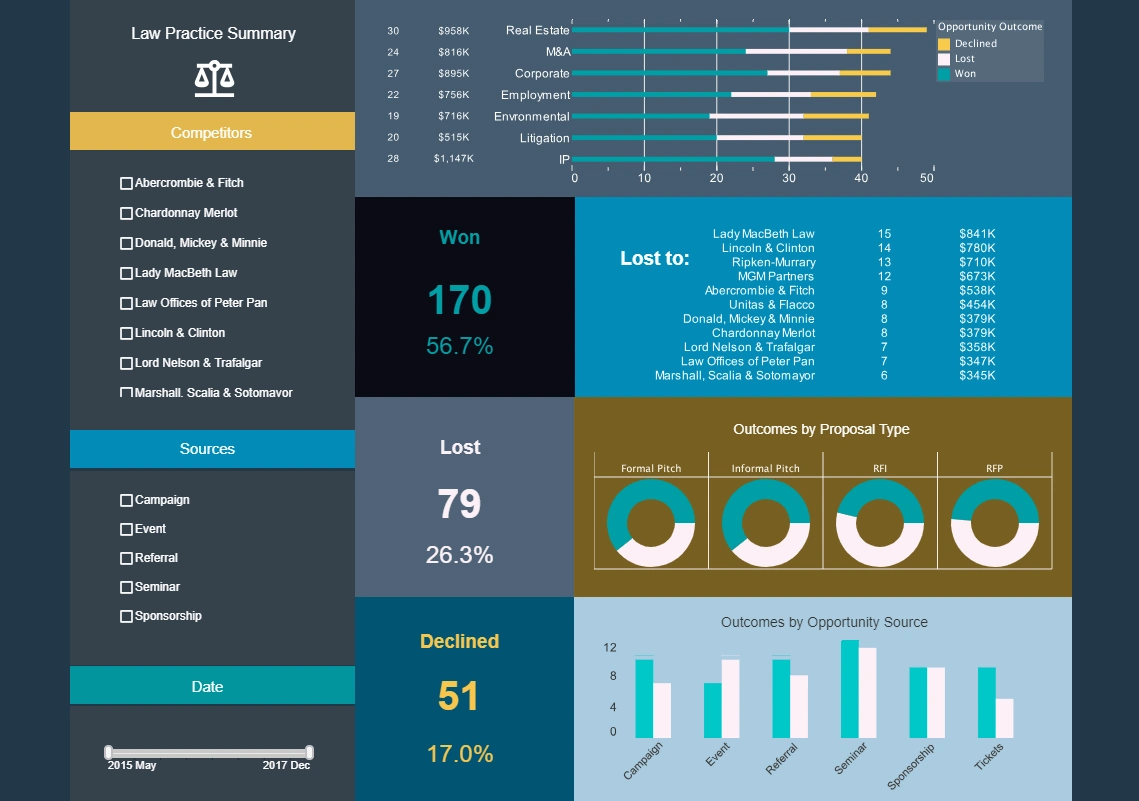
Rather than relying on pre-purposed BI needs, users can drag and drop blocks of desired information from their datasheets into various charts, tables, crosstabs, gauges, and more. Users can then personalize the dashboard by manipulating the size, color, text elements, and layout of an element with unlimited design options.
They can also use the web application to drill-down on data, or highlight and isolate a specific piece of data to get a closer look at relevant information. These explorations can then be saved and shared with other users on the web application to allow for collaboration among team members.
If you are looking for a way to take your data analysis to a new level, consider InetSoft as the dashboard web app to meet all your business needs.