Data Visualizer Software | InetSoft

Companies are employing data visualizer software to transform their raw data into understandable information. Data, or raw numbers without context, does not tell a story. It is only when you analyze data that you start to make insights, and the BI industry has found that visualization is the most cost effective way to make data analysis.

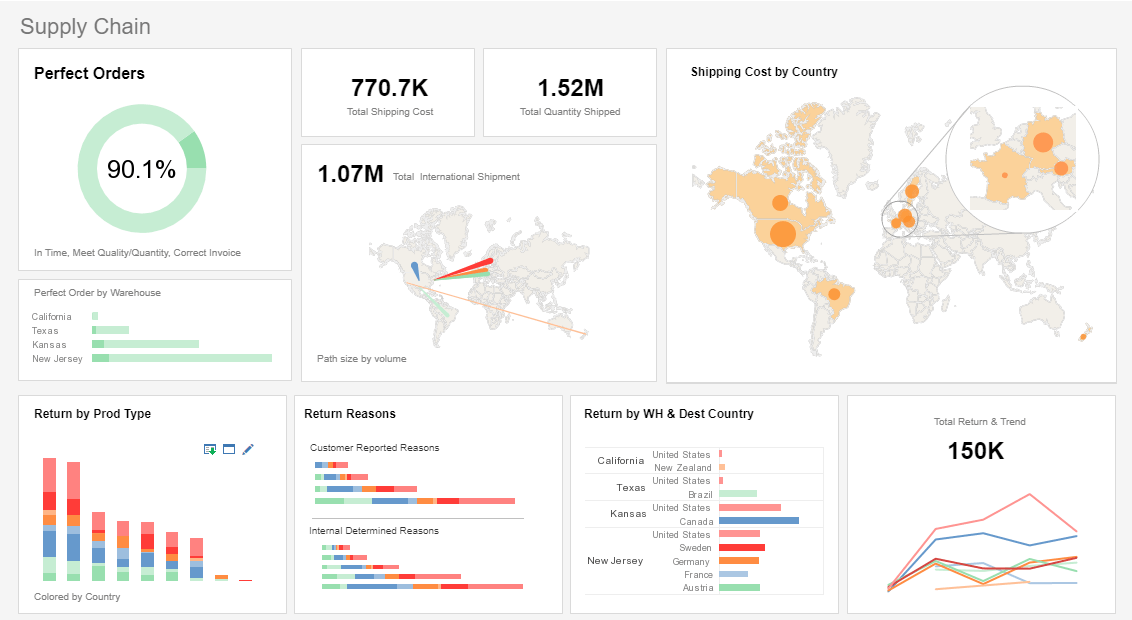
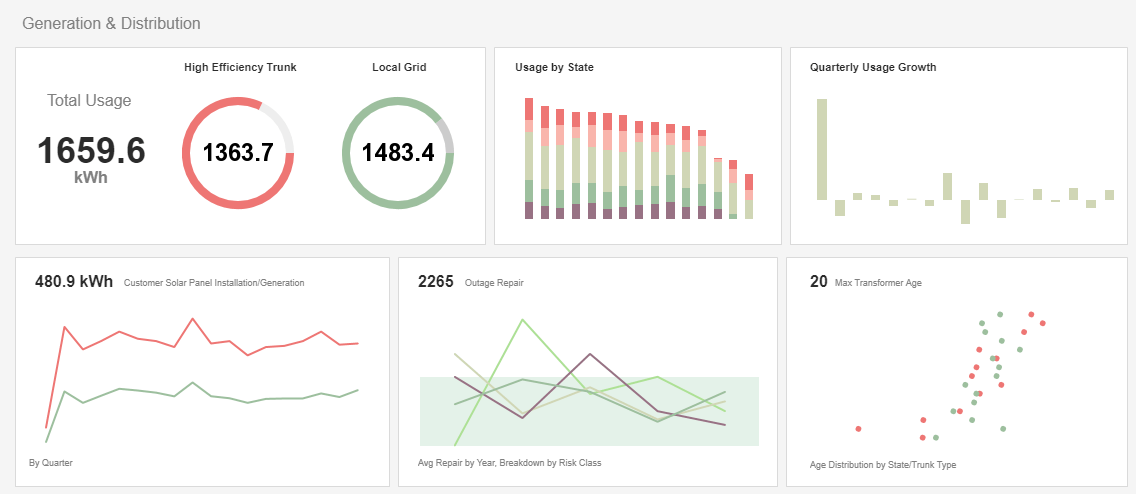
InetSoft has created a user friendly solution for data visualization needs, StyleBI. Even a novice with a basic Excel skills can wield the dynamic environment as if they are a data engineer that teaches software development classes at a prestigious tech university. Create a donut chart with a dozen colors in seconds, or combine bubble and line charts to display correlated data efficiently.

Use colors, shapes, and stacked x/y axes to add additional dimensions and measures, displaying more information in a single chart. With ranges of visual options that go far beyond the simple ability to select a chart type and colors, StyleBI users can ask their data complex and important questions and find visual solutions to all of their data analysis needs.
Business Intelligence | Visual Style

With InetSoft's tool, you can apply analysis to your data in ways you that previously required a data scientist. With the extremely fast load times in the StyleBI interactive environment, different data fields can be dragged and dropped into charts and filtering elements, allowing the user to start exploring their data after just a few clicks.

Mashing up data is a straightforward and utterly simple task. You can link a Salespeople table with a table of customer retention rates by dragging and dropping the two together, and StyleBI will produce a new data table showing which salesperson has the most loyal customers.

This mashup can now be saved and used in charts and tables, without editing the source data at all. When experimentation is this safe and easy, finding more nuance and generating complex questions becomes a rewarding experience instead of a delicate and technical operation.

#1 Ranking: Read how InetSoft was rated #1 for user adoption in G2's user survey-based index.

InetSoft | Better Visual Intelligence

The strongest feature of StyleBI is the user friendly environment that gives novices an opportunity to find data insights on their own. Case studies show that mastery of the InetSoft interface only takes a couple of hours, where other comparable programs often take assistance from an IT expert and knowledge of different coding languages.

Usually coding in SQL language dominates the utilization of BI products, keeping the insights that BI affords a business in a small group of a few employees. Studies show, however, that when BI reaches more employees business growth and employee production improve tremendously.

Using the StyleBI platform the user needs no knowledge of coding, SQL language, or any advanced IT to query a database. The kinds of charts that would require complex formulas in a spreadsheet program can be assembled using simple drag and drop. And since dashboards are built in an interactive web-based environment, experimentation does not alter the data source, so end-users are allowed to immediately begin exploring and editing their data without worrying about creating aberrations or damaging data content.

To find out more about how StyleBI can work to innovate your business strategy, register for a live product demo with InetSoft service representatives today.

“Flexible product with great training and support. The product has been very useful for quickly creating dashboards and data views. Support and training has always been available to us and quick to respond.
- George R, Information Technology Specialist at Sonepar USA

Related Information

Enterprise Data Visualization Tools & Software While other solutions require hours of painstaking back-end IT development... InetSoft allows even the average business user to build their own visual analyses and dashboards...

Intro to Data Visualization Data visualization... is the study of the visual representation of data. A closely related term, Information visualization is a process of transforming information into a visual form enabling the viewer to observe, browse, make sense of, and understand the information.

Introduction to Data Visualization Software Like Object Oriented programming, while it's possible to do without explicit language support, it's much nicer if the programming language provides explicit support such as classes and inheritance. The same is true with data visualization.

Style Scope - Visual Analysis & Real Time Business Intelligence Reporting InetSoft's Style Scope™ is an easy to use interactive dashboard software application that includes real time reporting capabilities. It is an edition of StyleBI that focuses on business data monitoring and exploration by...

InetSoft's Data Visualization Software Since 1996 InetSoft has been delivering easy, agile, and robust business intelligence software that makes it possible for organizations and solution providers of all sizes to deploy business intelligence solutions. Application highlights include visually-compelling, interactive dashboards...

A Fast and Easy Visualization Software Solution Are you looking for a program that can quickly assemble your data into something that provides useful information for your business? If you are, then consider InetSoft Technology's data visualization software solution, StyleBI.

The Best Data Visualization Tool for Monitoring Usage

This is the continuation of the transcript of DM Radio's program titled "What You See Is What You 'Get' - How Data Visualization Conveys Insight." Eric Kavanagh: "Okay, folks, back here at DM Radio talking all about data visualization and, hey, the bottom line is what works is what you should use. That's what you should go with. So you know monitoring usage and effectiveness of data visualization components should obviously be baked into that whole process...

Read full page...
Visualize Free - Free Visualization Software for Visual Analysis

If you're looking for free visualization software to perform data mining or explore your data with an easy to use visual analysis tool, try Visualize Free. Derived from our commercial business intelligence software, this free analytics application is designed to be very intuitive and interactive. Read about how a Free Visualization Tool can help...

Read full page...
Data Visualization Vendor: InetSoft Technology

Looking for data visualization vendors? As a BI pioneer since 1996, InetSoft offers Web-based visualization software that enterprises can deploy quickly, and ISV's can embed easily into their own applications. Read articles below for more information: "Data Visualization How To Techniques" "Data Visualization Software Download" "Data Visualizations Are Quick at Solving a Problem"

Read full page...
We will help you get started Contact us